
Concept explainers
Videos
Approximately 1.5 million high school students take the SAT each year and nearly 80% of the college and universities without open admissions policies use SAT scores in making admission decisions (College Board, March 2009). The current version of the SAT includes three parts: reading comprehension, mathematics, and writing. A perfect combined score for all three parts is 2400. A sample of SAT scores for the combined three-part SAT are as follows:
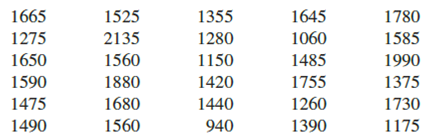
- a. Show a frequency distribution and histogram. Begin with the first class starting at 800 and use a class width of 200.
- b. Comment on the shape of the distribution.
- c. What other observations can be made about the SAT scores based on the tabular and graphical summaries?
a.
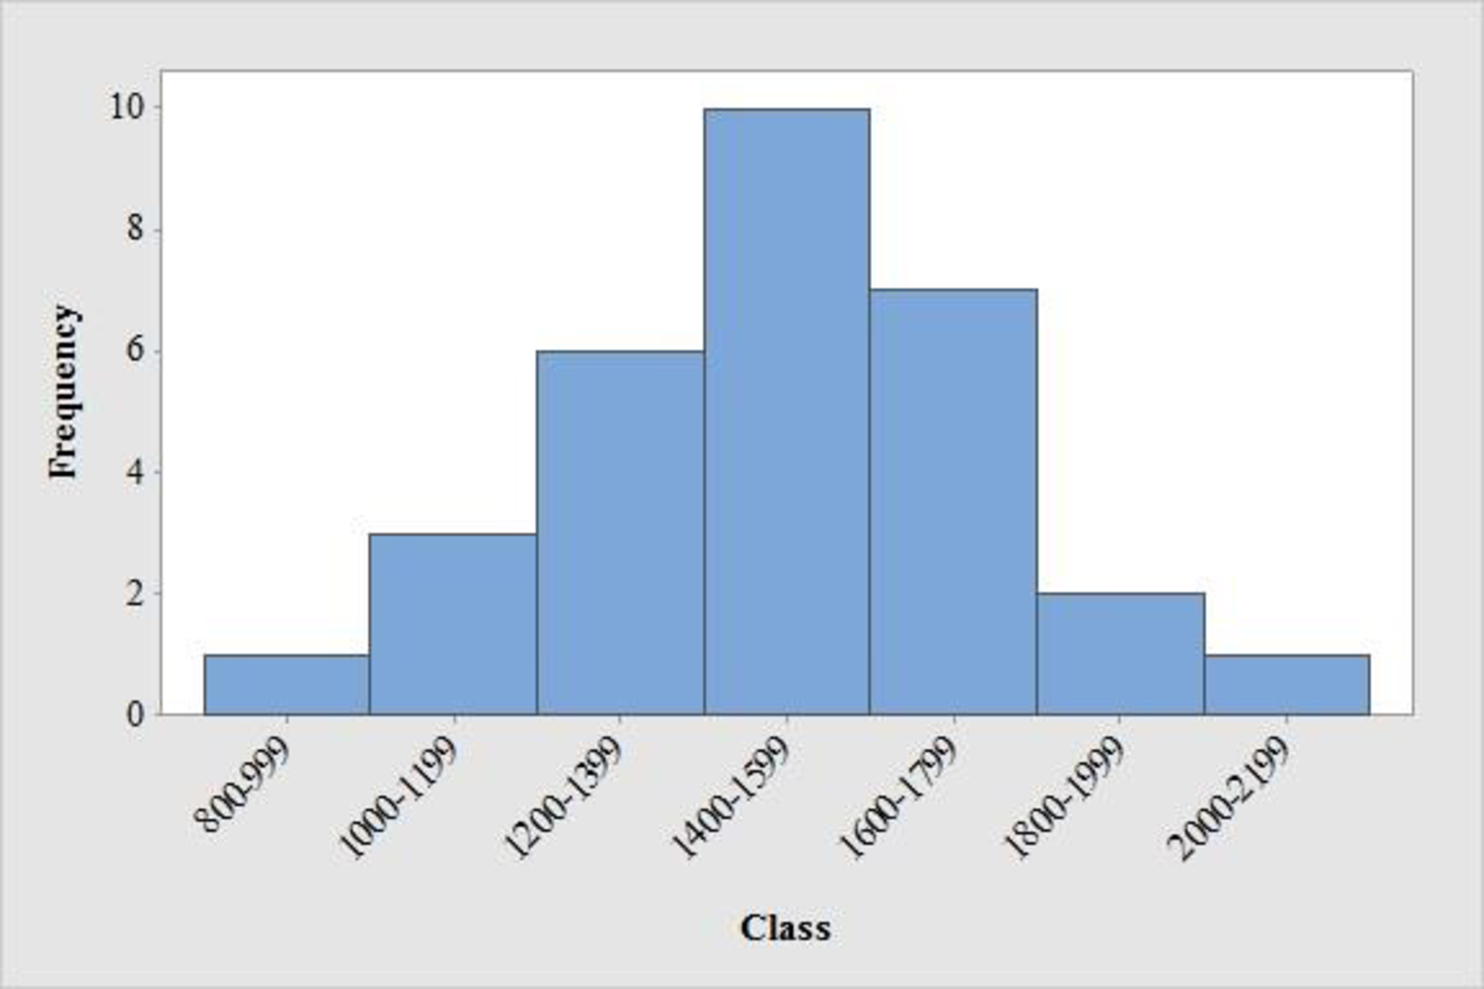
Construct the frequency distribution and histogram for the data.
Answer to Problem 44SE
The frequency distribution is tabulated below:
| Class | Tally | Frequency |
| 800-999 | 1 | |
| 1000-1199 | 3 | |
| 1200-1399 | 6 | |
| 1400-1599 | 10 | |
| 1600-1799 | 7 | |
| 1800-1999 | 2 | |
| 2000-2199 | 1 | |
| Total | 30 |
- Output using MINITAB software is given below:
Explanation of Solution
Calculation:
The data represents the sample of SAT scores for combined three part sat scores.
The frequencies are calculated by using the tally mark and the method of grouping is used because, range of the data is from 800 to 2,199. Here, the number of times each class levels repeats is the frequency of that particular class.
- From the given data set it is given that the class should be from approximately started with the class of 800 with class width of about 200.
- Make a tally mark for each value in the corresponding class and continue for all values in the data.
- The number of tally marks in each class represents the frequency, f of that class.
Similarly, the frequency of remaining classes for the data set is given below:
| Class | Tally | Frequency |
| 800-999 | 1 | |
| 1000-1199 | 3 | |
| 1200-1399 | 6 | |
| 1400-1599 | 10 | |
| 1600-1799 | 7 | |
| 1800-1999 | 2 | |
| 2000-2199 | 1 | |
| Total | 30 |
Software procedure:
Step by step procedure to draw the frequency histogram chart by using MINITAB software.
- Choose Graph > Histogram.
- Choose Simple, and then click OK.
- In Graph variables, enter the corresponding column of data.
- In scale on y-axis, make click on frequency.
- Click on ok.
b.
Comment the shape of the distribution.
Answer to Problem 44SE
The distribution of sat score is approximately symmetric.
Explanation of Solution
Symmetric distribution:
When the left and right sides of the distribution are approximately equal or mirror images of each other and three distributions will fall under symmetric distribution that is bell shaped, triangular and uniform or rectangular and then it is symmetric distribution.
From the graph, it is observed that the left and right side of the histogram is approximately equal. Hence, the shape of the distribution is bell-shaped curve.
Thus, it can be concluded that the distribution is approximately symmetric.
c.
Comment the observations of sat scores based on the tabular and graphical summary.
Explanation of Solution
From the data and the histogram, it is observed that approximately 33 percent of sat score (frequency about 10 of 30) will lie between 1400 and 1599.
- Moreover, the score less than 800 or greater than 2,200 are unusual and the average value of sat scores is over 1,500.
Want to see more full solutions like this?
Chapter 2 Solutions
STATISTICS F/BUSINESS+ECONOMICS-TEXT


- Question 2 A nickel-titanium alloy is used to make components for jet turbine aircraft engines. Cracking is a potentially serious problem in the final part because it can lead to nonrecoverable failure. A test is run at the parts producer to determine the effect of four factors on cracks. The four factors are: pouring temperature (A), titanium content (B), heat treatment method (C), amount of grain refiner used (D). Two replicates of a 24 design are run, and the length of crack (in mm x10-2) induced in a sample coupon subjected to a standard test is measured. The data are shown in Table 2. 1 (a) Estimate the factor effects. Which factor effects appear to be large? (b) Conduct an analysis of variance. Do any of the factors affect cracking? Use a = 0.05. (c) Write down a regression model that can be used to predict crack length as a function of the significant main effects and interactions you have identified in part (b). (d) Analyze the residuals from this experiment. (e) Is there an…arrow_forwardA 24-1 design has been used to investigate the effect of four factors on the resistivity of a silicon wafer. The data from this experiment are shown in Table 4. Table 4: Resistivity Experiment for Exercise 5 Run A B с D Resistivity 1 23 2 3 4 5 6 7 8 9 10 11 12 I+I+I+I+Oooo 0 0 ||++TI++o000 33.2 4.6 31.2 9.6 40.6 162.4 39.4 158.6 63.4 62.6 58.7 0 0 60.9 3 (a) Estimate the factor effects. Plot the effect estimates on a normal probability scale. (b) Identify a tentative model for this process. Fit the model and test for curvature. (c) Plot the residuals from the model in part (b) versus the predicted resistivity. Is there any indication on this plot of model inadequacy? (d) Construct a normal probability plot of the residuals. Is there any reason to doubt the validity of the normality assumption?arrow_forwardStem1: 1,4 Stem 2: 2,4,8 Stem3: 2,4 Stem4: 0,1,6,8 Stem5: 0,1,2,3,9 Stem 6: 2,2 What’s the Min,Q1, Med,Q3,Max?arrow_forward
- Are the t-statistics here greater than 1.96? What do you conclude? colgPA= 1.39+0.412 hsGPA (.33) (0.094) Find the P valuearrow_forwardA poll before the elections showed that in a given sample 79% of people vote for candidate C. How many people should be interviewed so that the pollsters can be 99% sure that from 75% to 83% of the population will vote for candidate C? Round your answer to the whole number.arrow_forwardSuppose a random sample of 459 married couples found that 307 had two or more personality preferences in common. In another random sample of 471 married couples, it was found that only 31 had no preferences in common. Let p1 be the population proportion of all married couples who have two or more personality preferences in common. Let p2 be the population proportion of all married couples who have no personality preferences in common. Find a95% confidence interval for . Round your answer to three decimal places.arrow_forward
- A history teacher interviewed a random sample of 80 students about their preferences in learning activities outside of school and whether they are considering watching a historical movie at the cinema. 69 answered that they would like to go to the cinema. Let p represent the proportion of students who want to watch a historical movie. Determine the maximal margin of error. Use α = 0.05. Round your answer to three decimal places. arrow_forwardA random sample of medical files is used to estimate the proportion p of all people who have blood type B. If you have no preliminary estimate for p, how many medical files should you include in a random sample in order to be 99% sure that the point estimate will be within a distance of 0.07 from p? Round your answer to the next higher whole number.arrow_forwardA clinical study is designed to assess the average length of hospital stay of patients who underwent surgery. A preliminary study of a random sample of 70 surgery patients’ records showed that the standard deviation of the lengths of stay of all surgery patients is 7.5 days. How large should a sample to estimate the desired mean to within 1 day at 95% confidence? Round your answer to the whole number.arrow_forward
- A clinical study is designed to assess the average length of hospital stay of patients who underwent surgery. A preliminary study of a random sample of 70 surgery patients’ records showed that the standard deviation of the lengths of stay of all surgery patients is 7.5 days. How large should a sample to estimate the desired mean to within 1 day at 95% confidence? Round your answer to the whole number.arrow_forwardIn the experiment a sample of subjects is drawn of people who have an elbow surgery. Each of the people included in the sample was interviewed about their health status and measurements were taken before and after surgery. Are the measurements before and after the operation independent or dependent samples?arrow_forwardiid 1. The CLT provides an approximate sampling distribution for the arithmetic average Ỹ of a random sample Y₁, . . ., Yn f(y). The parameters of the approximate sampling distribution depend on the mean and variance of the underlying random variables (i.e., the population mean and variance). The approximation can be written to emphasize this, using the expec- tation and variance of one of the random variables in the sample instead of the parameters μ, 02: YNEY, · (1 (EY,, varyi n For the following population distributions f, write the approximate distribution of the sample mean. (a) Exponential with rate ẞ: f(y) = ß exp{−ßy} 1 (b) Chi-square with degrees of freedom: f(y) = ( 4 ) 2 y = exp { — ½/ } г( (c) Poisson with rate λ: P(Y = y) = exp(-\} > y! y²arrow_forward
 Holt Mcdougal Larson Pre-algebra: Student Edition...AlgebraISBN:9780547587776Author:HOLT MCDOUGALPublisher:HOLT MCDOUGAL
 College Algebra (MindTap Course List)AlgebraISBN:9781305652231Author:R. David Gustafson, Jeff HughesPublisher:Cengage Learning
 Glencoe Algebra 1, Student Edition, 9780079039897...AlgebraISBN:9780079039897Author:CarterPublisher:McGraw Hill
 Big Ideas Math A Bridge To Success Algebra 1: Stu...AlgebraISBN:9781680331141Author:HOUGHTON MIFFLIN HARCOURTPublisher:Houghton Mifflin Harcourt