
Student Solutions Manual for Basic Business Statistics
13th Edition
ISBN: 9780321926708
Author: David M. Levine; Mark L. Berenson; Timothy C. Krehbiel; Kathryn A. Szabat; David F. Stephan
Publisher: Pearson Education
expand_more
expand_more
format_list_bulleted
Concept explainers
Videos
Textbook Question
Chapter 2, Problem 3PS
The following table, stored in smartphone sales, represents the annual percentage of smartphones sold in 2011, 2012, and 2013 (projected).
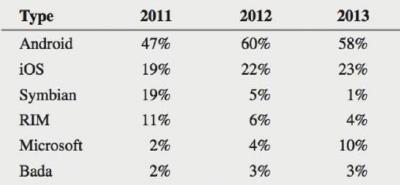
a. What conclusions can you reach about the market for smartphones in 2011, 2012, and 2013?
b. What differences are there in the market for smartphones in 2011, 2012. and 2013?
Expert Solution & Answer
Want to see the full answer?
Check out a sample textbook solution
Students have asked these similar questions
Suppose you know that Bob's test score is
above the mean, but he doesn't remember by
how much. At least how many students must
score lower than Bob?
If a baby's weight is at the median, what's
her percentile?
At the same restaurant as in Question 19 with
the same normal distribution, what's the
chance of it taking no more than 15 minutes
to get service?
Chapter 2 Solutions
Student Solutions Manual for Basic Business Statistics
Ch. 2 - A categorical variable has three categories, with...Ch. 2 - The following data represent the responses to two...Ch. 2 - The following table, stored in smartphone sales,...Ch. 2 - The Edmunds.com NHTSA Complaints Activity Report...Ch. 2 - The 2013 Mortimer Spinks and Computer Weekly...Ch. 2 - The following table represents world oil...Ch. 2 - Visier’s Survey of Employers explores how North...Ch. 2 - A survey of 1,085 adults asked “Do you enjoy...Ch. 2 - Prob. 9PSCh. 2 - Do special recommendations increase ad...
Ch. 2 - Construct an ordered array, given the following...Ch. 2 - Construct an ordered array, given the following...Ch. 2 - Prob. 13PSCh. 2 - Prob. 14PSCh. 2 - Prob. 15PSCh. 2 - The file Utility contains the following data about...Ch. 2 - How much time do commuters living in or near...Ch. 2 - How do the average credit scores of people living...Ch. 2 - One operation of a mill is to cut pieces of steel...Ch. 2 - Prob. 20PSCh. 2 - Prob. 21PSCh. 2 - Prob. 22PSCh. 2 - The file Drink Contains the following data for the...Ch. 2 - Prob. 24PSCh. 2 - Prob. 25PSCh. 2 - Prob. 26PSCh. 2 - Prob. 27PSCh. 2 - Prob. 28PSCh. 2 - Prob. 29PSCh. 2 - Prob. 30PSCh. 2 - Prob. 31PSCh. 2 - Do special recommendations increase ad...Ch. 2 - Construct a stern-and-leaf display, given the...Ch. 2 - Construct an ordered array, given the following...Ch. 2 - The following is a stern-and0-leaf display...Ch. 2 - Prob. 36PSCh. 2 - The file MobileSpeed contains the overall download...Ch. 2 - The file Utility contains the following data about...Ch. 2 - Prob. 39PSCh. 2 - Prob. 40PSCh. 2 - How much time do Americans living in or near...Ch. 2 - How do the average credit scores of people living...Ch. 2 - One operation of a mill is to cut pieces of steel...Ch. 2 - Prob. 44PSCh. 2 - Prob. 45PSCh. 2 - Prob. 46PSCh. 2 - The data stored in Drink represents the amount of...Ch. 2 - The following is a set of data from a sample of...Ch. 2 - Prob. 49PSCh. 2 - Movie companies need to predict the gross receipts...Ch. 2 - Data were collected on the typical cost of dining...Ch. 2 - Prob. 52PSCh. 2 - Prob. 53PSCh. 2 - How have stocks performed in the past? The...Ch. 2 - Prob. 55PSCh. 2 - Prob. 56PSCh. 2 - The file Audits contains the number of audits of...Ch. 2 - Prob. 58PSCh. 2 - Prob. 59PSCh. 2 - Prob. 60PSCh. 2 - Using the sample of retirement funds stored in...Ch. 2 - Prob. 65PSCh. 2 - Prob. 66PSCh. 2 - Examine the following visualization, adapted from...Ch. 2 - Prob. 69PSCh. 2 - Prob. 70PSCh. 2 - How do histograms and polygons differ in...Ch. 2 - Why would you construct a summary table?Ch. 2 - What are the advantages and disadvantage of using...Ch. 2 - Compare and contrast the bar chart for categorical...Ch. 2 - What is the difference between a time-series plot...Ch. 2 - Why is it said that the main feature of a Pareto...Ch. 2 - What are the three different ways to break down...Ch. 2 - How can a multidimensional table differ from a...Ch. 2 - What type of insights can you gain from a...Ch. 2 - The following summary, table, presents the...Ch. 2 - The following table represents the market share...Ch. 2 - Prob. 82PSCh. 2 - The owner of a restaurant that services...Ch. 2 - Prob. 84PSCh. 2 - The following data represents the pounds per...Ch. 2 - Prob. 86PSCh. 2 - One of the major measures of the quality of...Ch. 2 - Prob. 88PSCh. 2 - Prob. 89PSCh. 2 - Prob. 90PSCh. 2 - Prob. 91PSCh. 2 - Prob. 92PSCh. 2 - What was the average price of a room at two-star,...Ch. 2 - The file Protein contains calorie and cholesterol...Ch. 2 - The file Natural Gas contains the U.S. monthly...Ch. 2 - Prob. 96PSCh. 2 - Prob. 97PSCh. 2 - A/B testing allows business to test a new design...
Knowledge Booster


Learn more about
Need a deep-dive on the concept behind this application? Look no further. Learn more about this topic, statistics and related others by exploring similar questions and additional content below.Similar questions
- Clint, obviously not in college, sleeps an average of 8 hours per night with a standard deviation of 15 minutes. What's the chance of him sleeping between 7.5 and 8.5 hours on any given night? 0-(7-0) 200 91109s and doiw $20 (8-0) mol 8520 slang $199 galbrog seam side pide & D (newid se od poyesvig as PELEO PER AFTE editiw noudab temand van Czarrow_forwardTimes to complete a statistics exam have a normal distribution with a mean of 40 minutes and standard deviation of 6 minutes. Deshawn's time comes in at the 90th percentile. What percentage of the students are still working on their exams when Deshawn leaves?arrow_forwardSuppose that the weights of cereal boxes have a normal distribution with a mean of 20 ounces and standard deviation of half an ounce. A box that has a standard score of o weighs how much? syed by ilog ni 21arrow_forward
- Bob scores 80 on both his math exam (which has a mean of 70 and standard deviation of 10) and his English exam (which has a mean of 85 and standard deviation of 5). Find and interpret Bob's Z-scores on both exams to let him know which exam (if either) he did bet- ter on. Don't, however, let his parents know; let them think he's just as good at both subjects. algas 70) sering digarrow_forwardSue's math class exam has a mean of 70 with a standard deviation of 5. Her standard score is-2. What's her original exam score?arrow_forwardClint sleeps an average of 8 hours per night with a standard deviation of 15 minutes. What's the chance he will sleep less than 7.5 hours tonight? nut bow visarrow_forward
- Suppose that your score on an exam is directly at the mean. What's your standard score?arrow_forwardOne state's annual rainfall has a normal dis- tribution with a mean of 100 inches and standard deviation of 25 inches. Suppose that corn grows best when the annual rainfall is between 100 and 150 inches. What's the chance of achieving this amount of rainfall? wved now of sociarrow_forward13 Suppose that your exam score has a standard score of 0.90. Does this mean that 90 percent of the other exam scores are lower than yours?arrow_forward
- Bob's commuting times to work have a nor- mal distribution with a mean of 45 minutes and standard deviation of 10 minutes. How often does Bob get to work in 30 to 45 minutes?arrow_forwardBob's commuting times to work have a nor- mal distribution with a mean of 45 minutes and standard deviation of 10 minutes. a. What percentage of the time does Bob get to work in 30 minutes or less? b. Bob's workday starts at 9 a.m. If he leaves at 8 a.m., how often is he late?arrow_forwardSuppose that you want to put fat Fido on a weight-loss program. Before the program, his weight had a standard score of +2 com- pared to dogs of his breed/age, and after the program, his weight has a standard score of -2. His weight before the program was 150 pounds, and the standard deviation for the breed is 5 pounds. a. What's the mean weight for Fido's breed/ age? b. What's his weight after the weight-loss program?arrow_forward
arrow_back_ios
SEE MORE QUESTIONS
arrow_forward_ios
Recommended textbooks for you
 Glencoe Algebra 1, Student Edition, 9780079039897...AlgebraISBN:9780079039897Author:CarterPublisher:McGraw Hill
 Holt Mcdougal Larson Pre-algebra: Student Edition...AlgebraISBN:9780547587776Author:HOLT MCDOUGALPublisher:HOLT MCDOUGAL
 Big Ideas Math A Bridge To Success Algebra 1: Stu...AlgebraISBN:9781680331141Author:HOUGHTON MIFFLIN HARCOURTPublisher:Houghton Mifflin Harcourt
 Functions and Change: A Modeling Approach to Coll...AlgebraISBN:9781337111348Author:Bruce Crauder, Benny Evans, Alan NoellPublisher:Cengage Learning
 College Algebra (MindTap Course List)AlgebraISBN:9781305652231Author:R. David Gustafson, Jeff HughesPublisher:Cengage Learning
Glencoe Algebra 1, Student Edition, 9780079039897...
Algebra
ISBN:9780079039897
Author:Carter
Publisher:McGraw Hill
Holt Mcdougal Larson Pre-algebra: Student Edition...
Algebra
ISBN:9780547587776
Author:HOLT MCDOUGAL
Publisher:HOLT MCDOUGAL
Big Ideas Math A Bridge To Success Algebra 1: Stu...
Algebra
ISBN:9781680331141
Author:HOUGHTON MIFFLIN HARCOURT
Publisher:Houghton Mifflin Harcourt
Functions and Change: A Modeling Approach to Coll...
Algebra
ISBN:9781337111348
Author:Bruce Crauder, Benny Evans, Alan Noell
Publisher:Cengage Learning
College Algebra (MindTap Course List)
Algebra
ISBN:9781305652231
Author:R. David Gustafson, Jeff Hughes
Publisher:Cengage Learning
The Shape of Data: Distributions: Crash Course Statistics #7; Author: CrashCourse;https://www.youtube.com/watch?v=bPFNxD3Yg6U;License: Standard YouTube License, CC-BY
Shape, Center, and Spread - Module 20.2 (Part 1); Author: Mrmathblog;https://www.youtube.com/watch?v=COaid7O_Gag;License: Standard YouTube License, CC-BY
Shape, Center and Spread; Author: Emily Murdock;https://www.youtube.com/watch?v=_YyW0DSCzpM;License: Standard Youtube License