
Loose Leaf for Statistical Techniques in Business and Economics (Mcgraw-hill/Irwin Series in Operations and Decision Sciences)
16th Edition
ISBN: 9780077639709
Author: Douglas A. Lind, William G Marchal, Samuel A. Wathen
Publisher: McGraw-Hill Education
expand_more
expand_more
format_list_bulleted
Concept explainers
Videos
Textbook Question
Chapter 2, Problem 35CE
The following histogram shows the scores on the first exam for a statistics class.
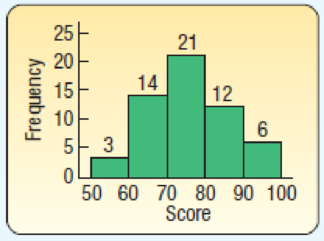
- a. How many students took the exam?
- b. What is the class interval?
- c. What is the class midpoint for the first class?
- d. How many students earned a score of less than 70?
Expert Solution & Answer
Want to see the full answer?
Check out a sample textbook solution
Students have asked these similar questions
Question 2. An American option on a stock has payoff given by F = f(St) when it is exercised
at time t. We know that the function f is convex. A person claims that because of convexity,
it is optimal to exercise at expiration T. Do you agree with them?
Question 4. We consider a CRR model with So == 5 and up and down factors u = 1.03 and
d = 0.96. We consider the interest rate r = 4% (over one period). Is this a suitable CRR
model? (Explain your answer.)
Question 3. We want to price a put option with strike price K and expiration T. Two financial
advisors estimate the parameters with two different statistical methods: they obtain the same
return rate μ, the same volatility σ, but the first advisor has interest r₁ and the second advisor
has interest rate r2 (r1>r2). They both use a CRR model with the same number of periods to
price the option. Which advisor will get the larger price? (Explain your answer.)
Chapter 2 Solutions
Loose Leaf for Statistical Techniques in Business and Economics (Mcgraw-hill/Irwin Series in Operations and Decision Sciences)
Ch. 2 - DeCenzo Specialty Food and Beverage Company has...Ch. 2 - A pie chart shows the relative market share of...Ch. 2 - In a marketing study, 100 consumers were asked to...Ch. 2 - A total of 1,000 residents in Minnesota were asked...Ch. 2 - Two thousand frequent business travelers are asked...Ch. 2 - Wellstone Inc. produces and markets replacement...Ch. 2 - A small business consultant is investigating the...Ch. 2 - In the first quarter of last year, the 11 members...Ch. 2 - Prob. 3SRCh. 2 - A set of data consists of 38 observations. How...
Ch. 2 - A set of data consists of 45 observations between...Ch. 2 - A set of data consists of 230 observations between...Ch. 2 - A set of data contains 53 observations. The...Ch. 2 - Wachesaw Manufacturing Inc. produced the following...Ch. 2 - The Quick Change Oil Company has a number of...Ch. 2 - The manager of the BiLo Supermarket in Mt....Ch. 2 - The food services division of Cedar River...Ch. 2 - The annual imports of a selected group of...Ch. 2 - Mollys Candle Shop has several retail stores in...Ch. 2 - The following chart shows the number of patients...Ch. 2 - The following frequency distribution reports the...Ch. 2 - Ecommerce.com, a large Internet retailer, is...Ch. 2 - A sample of the hourly wages of 15 employees at...Ch. 2 - The following cumulative frequency and the...Ch. 2 - The cumulative frequency and the cumulative...Ch. 2 - The frequency distribution representing the number...Ch. 2 - The frequency distribution of order lead time at...Ch. 2 - Describe the similarities and differences of...Ch. 2 - Describe the similarities and differences between...Ch. 2 - Alexandra Damonte will be building a new resort in...Ch. 2 - Speedy Swift is a package delivery service that...Ch. 2 - A data set consists of 83 observations. How many...Ch. 2 - A data set consists of 145 observations that range...Ch. 2 - The following is the number of minutes to commute...Ch. 2 - The following data give the weekly amounts spent...Ch. 2 - A social scientist is studying the use of iPods by...Ch. 2 - David Wise handles his own investment portfolio,...Ch. 2 - You are exploring the music in your iTunes...Ch. 2 - The monthly issues of the Journal of Finance are...Ch. 2 - The following histogram shows the scores on the...Ch. 2 - The following chart summarizes the selling price...Ch. 2 - A chain of sport shops catering to beginning...Ch. 2 - The numbers of outstanding shares for 24 publicly...Ch. 2 - A recent survey showed that the typical American...Ch. 2 - Midland National Bank selected a sample of 40...Ch. 2 - Residents of the state of South Carolina earned a...Ch. 2 - A recent study of home technologies reported the...Ch. 2 - Merrill Lynch recently completed a study regarding...Ch. 2 - A total of 5.9% of the prime-time viewing audience...Ch. 2 - Refer to the following chart: a. What is the name...Ch. 2 - The following chart depicts the annual revenues,...Ch. 2 - In 2011, the United States exported a total of 281...Ch. 2 - In the United States, the industrial revolution of...Ch. 2 - One of the most popular candies in the United...Ch. 2 - The number of families who used the Minneapolis...Ch. 2 - Refer to the Real Estate data, which reports...Ch. 2 - Refer to the Baseball 2012 data that report...Ch. 2 - Prob. 53DE
Knowledge Booster


Learn more about
Need a deep-dive on the concept behind this application? Look no further. Learn more about this topic, statistics and related others by exploring similar questions and additional content below.Similar questions
- Question 5. We consider a put option with strike price K and expiration T. This option is priced using a 1-period CRR model. We consider r > 0, and σ > 0 very large. What is the approximate price of the option? In other words, what is the limit of the price of the option as σ∞. (Briefly justify your answer.)arrow_forwardQuestion 6. You collect daily data for the stock of a company Z over the past 4 months (i.e. 80 days) and calculate the log-returns (yk)/(-1. You want to build a CRR model for the evolution of the stock. The expected value and standard deviation of the log-returns are y = 0.06 and Sy 0.1. The money market interest rate is r = 0.04. Determine the risk-neutral probability of the model.arrow_forwardSeveral markets (Japan, Switzerland) introduced negative interest rates on their money market. In this problem, we will consider an annual interest rate r < 0. We consider a stock modeled by an N-period CRR model where each period is 1 year (At = 1) and the up and down factors are u and d. (a) We consider an American put option with strike price K and expiration T. Prove that if <0, the optimal strategy is to wait until expiration T to exercise.arrow_forward
- We consider an N-period CRR model where each period is 1 year (At = 1), the up factor is u = 0.1, the down factor is d = e−0.3 and r = 0. We remind you that in the CRR model, the stock price at time tn is modeled (under P) by Sta = So exp (μtn + σ√AtZn), where (Zn) is a simple symmetric random walk. (a) Find the parameters μ and σ for the CRR model described above. (b) Find P Ste So 55/50 € > 1). StN (c) Find lim P 804-N (d) Determine q. (You can use e- 1 x.) Ste (e) Find Q So (f) Find lim Q 004-N StN Soarrow_forwardIn this problem, we consider a 3-period stock market model with evolution given in Fig. 1 below. Each period corresponds to one year. The interest rate is r = 0%. 16 22 28 12 16 12 8 4 2 time Figure 1: Stock evolution for Problem 1. (a) A colleague notices that in the model above, a movement up-down leads to the same value as a movement down-up. He concludes that the model is a CRR model. Is your colleague correct? (Explain your answer.) (b) We consider a European put with strike price K = 10 and expiration T = 3 years. Find the price of this option at time 0. Provide the replicating portfolio for the first period. (c) In addition to the call above, we also consider a European call with strike price K = 10 and expiration T = 3 years. Which one has the highest price? (It is not necessary to provide the price of the call.) (d) We now assume a yearly interest rate r = 25%. We consider a Bermudan put option with strike price K = 10. It works like a standard put, but you can exercise it…arrow_forwardIn this problem, we consider a 2-period stock market model with evolution given in Fig. 1 below. Each period corresponds to one year (At = 1). The yearly interest rate is r = 1/3 = 33%. This model is a CRR model. 25 15 9 10 6 4 time Figure 1: Stock evolution for Problem 1. (a) Find the values of up and down factors u and d, and the risk-neutral probability q. (b) We consider a European put with strike price K the price of this option at time 0. == 16 and expiration T = 2 years. Find (c) Provide the number of shares of stock that the replicating portfolio contains at each pos- sible position. (d) You find this option available on the market for $2. What do you do? (Short answer.) (e) We consider an American put with strike price K = 16 and expiration T = 2 years. Find the price of this option at time 0 and describe the optimal exercising strategy. (f) We consider an American call with strike price K ○ = 16 and expiration T = 2 years. Find the price of this option at time 0 and describe…arrow_forward
- 2.2, 13.2-13.3) question: 5 point(s) possible ubmit test The accompanying table contains the data for the amounts (in oz) in cans of a certain soda. The cans are labeled to indicate that the contents are 20 oz of soda. Use the sign test and 0.05 significance level to test the claim that cans of this soda are filled so that the median amount is 20 oz. If the median is not 20 oz, are consumers being cheated? Click the icon to view the data. What are the null and alternative hypotheses? OA. Ho: Medi More Info H₁: Medi OC. Ho: Medi H₁: Medi Volume (in ounces) 20.3 20.1 20.4 Find the test stat 20.1 20.5 20.1 20.1 19.9 20.1 Test statistic = 20.2 20.3 20.3 20.1 20.4 20.5 Find the P-value 19.7 20.2 20.4 20.1 20.2 20.2 P-value= (R 19.9 20.1 20.5 20.4 20.1 20.4 Determine the p 20.1 20.3 20.4 20.2 20.3 20.4 Since the P-valu 19.9 20.2 19.9 Print Done 20 oz 20 oz 20 oz 20 oz ce that the consumers are being cheated.arrow_forwardT Teenage obesity (O), and weekly fast-food meals (F), among some selected Mississippi teenagers are: Name Obesity (lbs) # of Fast-foods per week Josh 185 10 Karl 172 8 Terry 168 9 Kamie Andy 204 154 12 6 (a) Compute the variance of Obesity, s²o, and the variance of fast-food meals, s², of this data. [Must show full work]. (b) Compute the Correlation Coefficient between O and F. [Must show full work]. (c) Find the Coefficient of Determination between O and F. [Must show full work]. (d) Obtain the Regression equation of this data. [Must show full work]. (e) Interpret your answers in (b), (c), and (d). (Full explanations required). Edit View Insert Format Tools Tablearrow_forwardThe average miles per gallon for a sample of 40 cars of model SX last year was 32.1, with a population standard deviation of 3.8. A sample of 40 cars from this year’s model SX has an average of 35.2 mpg, with a population standard deviation of 5.4. Find a 99 percent confidence interval for the difference in average mpg for this car brand (this year’s model minus last year’s).Find a 99 percent confidence interval for the difference in average mpg for last year’s model minus this year’s. What does the negative difference mean?arrow_forward
- A special interest group reports a tiny margin of error (plus or minus 0.04 percent) for its online survey based on 50,000 responses. Is the margin of error legitimate? (Assume that the group’s math is correct.)arrow_forwardSuppose that 73 percent of a sample of 1,000 U.S. college students drive a used car as opposed to a new car or no car at all. Find an 80 percent confidence interval for the percentage of all U.S. college students who drive a used car.What sample size would cut this margin of error in half?arrow_forwardYou want to compare the average number of tines on the antlers of male deer in two nearby metro parks. A sample of 30 deer from the first park shows an average of 5 tines with a population standard deviation of 3. A sample of 35 deer from the second park shows an average of 6 tines with a population standard deviation of 3.2. Find a 95 percent confidence interval for the difference in average number of tines for all male deer in the two metro parks (second park minus first park).Do the parks’ deer populations differ in average size of deer antlers?arrow_forward
arrow_back_ios
SEE MORE QUESTIONS
arrow_forward_ios
Recommended textbooks for you
 Big Ideas Math A Bridge To Success Algebra 1: Stu...AlgebraISBN:9781680331141Author:HOUGHTON MIFFLIN HARCOURTPublisher:Houghton Mifflin Harcourt
 Glencoe Algebra 1, Student Edition, 9780079039897...AlgebraISBN:9780079039897Author:CarterPublisher:McGraw Hill
 Holt Mcdougal Larson Pre-algebra: Student Edition...AlgebraISBN:9780547587776Author:HOLT MCDOUGALPublisher:HOLT MCDOUGAL
 Functions and Change: A Modeling Approach to Coll...AlgebraISBN:9781337111348Author:Bruce Crauder, Benny Evans, Alan NoellPublisher:Cengage Learning
Big Ideas Math A Bridge To Success Algebra 1: Stu...
Algebra
ISBN:9781680331141
Author:HOUGHTON MIFFLIN HARCOURT
Publisher:Houghton Mifflin Harcourt
Glencoe Algebra 1, Student Edition, 9780079039897...
Algebra
ISBN:9780079039897
Author:Carter
Publisher:McGraw Hill
Holt Mcdougal Larson Pre-algebra: Student Edition...
Algebra
ISBN:9780547587776
Author:HOLT MCDOUGAL
Publisher:HOLT MCDOUGAL
Functions and Change: A Modeling Approach to Coll...
Algebra
ISBN:9781337111348
Author:Bruce Crauder, Benny Evans, Alan Noell
Publisher:Cengage Learning
The Shape of Data: Distributions: Crash Course Statistics #7; Author: CrashCourse;https://www.youtube.com/watch?v=bPFNxD3Yg6U;License: Standard YouTube License, CC-BY
Shape, Center, and Spread - Module 20.2 (Part 1); Author: Mrmathblog;https://www.youtube.com/watch?v=COaid7O_Gag;License: Standard YouTube License, CC-BY
Shape, Center and Spread; Author: Emily Murdock;https://www.youtube.com/watch?v=_YyW0DSCzpM;License: Standard Youtube License