
Intro Stats
4th Edition
ISBN: 9780321826275
Author: Richard D. De Veaux
Publisher: PEARSON
expand_more
expand_more
format_list_bulleted
Videos
Textbook Question
Chapter 2, Problem 34E
Parking lots A survey of autos parked in student and staff lots at a large university classified the brands by country of origin, as seen in the table.
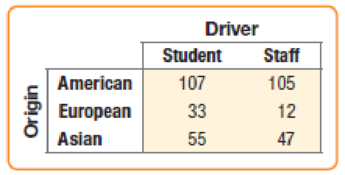
- a) What percent of all the cars surveyed were foreign?
- b) What percent of the American cars were owned by students?
- c) What percent of the students owned American cars?
- d) What is the marginal distribution of origin?
- e) What are the conditional distributions of origin by driver classification?
- f) Do you think that the origin of the car is independent of the type of driver? Explain.
Expert Solution & Answer
Want to see the full answer?
Check out a sample textbook solution
Students have asked these similar questions
Suppose an experiment was conducted to compare the mileage(km) per litre
obtained by competing brands of petrol I,II,III. Three new Mazda, three new
Toyota and three new Nissan cars were available for experimentation. During the
experiment the cars would operate under same conditions in order to eliminate
the effect of external variables on the distance travelled per litre on the assigned
brand of petrol. The data is given as below:
Brands of Petrol Mazda Toyota Nissan
I 10.6 12.0 11.0
II 9.0 15.0 12.0
III 12.0 17.4 13.0
(a) Test at the 5% level of significance whether there are signi
cant differences among the brands of fuels and also among the cars. [10]
(b) Compute the standard error for comparing any two fuel brands means. Hence
compare, at the 5% level of significance, each of fuel brands II, and III with
the standard fuel brand I. [10] �
Business discuss
What would you say about a set of quantitative bivariate data whose linear correlation is -1? What would a scatter diagram of the data look like? (5 points)
Chapter 2 Solutions
Intro Stats
Ch. 2.2 - A statistics class reports the following data on...Ch. 2.2 - A statistics class reports the following data on...Ch. 2.2 - A statistics class reports the following data on...Ch. 2.2 - Prob. 4JCCh. 2.2 - Prob. 5JCCh. 2.2 - A statistics class reports the following data on...Ch. 2.2 - Prob. 7JCCh. 2 - Prob. 1ECh. 2 - Prob. 2ECh. 2 - Prob. 3E
Ch. 2 - Marriage in decline Changing attitudes about...Ch. 2 - 5. Movies again The following table summarizes 348...Ch. 2 - Prob. 6ECh. 2 - Prob. 11ECh. 2 - 12. Movie ratings The pie chart shows the ratings...Ch. 2 - Prob. 13ECh. 2 - Prob. 14ECh. 2 - Prob. 15ECh. 2 - Prob. 16ECh. 2 - Prob. 17ECh. 2 - Prob. 18ECh. 2 - Prob. 19ECh. 2 - Prob. 20ECh. 2 - Prob. 21ECh. 2 - Modalities A survey of athletic trainers asked...Ch. 2 - Prob. 23ECh. 2 - Prob. 24ECh. 2 - Prob. 25ECh. 2 - Prob. 26ECh. 2 - Prob. 27ECh. 2 - Politics Students in an Intro Stats course were...Ch. 2 - More about seniors Look again at the table of...Ch. 2 - Politics revisited Look again at the table of...Ch. 2 - Prob. 31ECh. 2 - More politics Look once more at the table...Ch. 2 - Prob. 33ECh. 2 - Parking lots A survey of autos parked in student...Ch. 2 - Weather forecasts Just how accurate are the...Ch. 2 - Prob. 36ECh. 2 - Blood pressure A company held a blood pressure...Ch. 2 - Prob. 38ECh. 2 - Prob. 39ECh. 2 - Antidepressants and bone fractures For a period of...Ch. 2 - Prob. 41ECh. 2 - Prob. 42ECh. 2 - Hospitals Most patients who undergo surgery make...Ch. 2 - Delivery service A company must decide which of...Ch. 2 - Graduate admissions A 1975 article in the magazine...Ch. 2 - Be a Simpson Can you design a Simpsons paradox?...
Additional Math Textbook Solutions
Find more solutions based on key concepts
(a) Make a stem-and-leaf plot for these 24 observations on the number of customers who used a down-town CitiBan...
APPLIED STAT.IN BUS.+ECONOMICS
The largest polynomial that divides evenly into a list of polynomials is called the _______.
Elementary & Intermediate Algebra
153. A rain gutter is made from sheets of aluminum that are 20 inches wide. As shown in the figure, the edges ...
College Algebra (7th Edition)
Find all solutions of each equation in the interval .
Precalculus: A Unit Circle Approach (3rd Edition)
NOTE: Write your answers using interval notation when appropriate.
CHECKING ANALYTIC SKILLS Fill in each blank ...
Graphical Approach To College Algebra
Provide an example of a qualitative variable and an example of a quantitative variable.
Elementary Statistics ( 3rd International Edition ) Isbn:9781260092561
Knowledge Booster


Learn more about
Need a deep-dive on the concept behind this application? Look no further. Learn more about this topic, statistics and related others by exploring similar questions and additional content below.Similar questions
- Business discussarrow_forwardAnalyze the residuals of a linear regression model and select the best response. yes, the residual plot does not show a curve no, the residual plot shows a curve yes, the residual plot shows a curve no, the residual plot does not show a curve I answered, "No, the residual plot shows a curve." (and this was incorrect). I am not sure why I keep getting these wrong when the answer seems obvious. Please help me understand what the yes and no references in the answer.arrow_forwarda. Find the value of A.b. Find pX(x) and py(y).c. Find pX|y(x|y) and py|X(y|x)d. Are x and y independent? Why or why not?arrow_forward
- Analyze the residuals of a linear regression model and select the best response.Criteria is simple evaluation of possible indications of an exponential model vs. linear model) no, the residual plot does not show a curve yes, the residual plot does not show a curve yes, the residual plot shows a curve no, the residual plot shows a curve I selected: yes, the residual plot shows a curve and it is INCORRECT. Can u help me understand why?arrow_forwardYou have been hired as an intern to run analyses on the data and report the results back to Sarah; the five questions that Sarah needs you to address are given below. please do it step by step on excel Does there appear to be a positive or negative relationship between price and screen size? Use a scatter plot to examine the relationship. Determine and interpret the correlation coefficient between the two variables. In your interpretation, discuss the direction of the relationship (positive, negative, or zero relationship). Also discuss the strength of the relationship. Estimate the relationship between screen size and price using a simple linear regression model and interpret the estimated coefficients. (In your interpretation, tell the dollar amount by which price will change for each unit of increase in screen size). Include the manufacturer dummy variable (Samsung=1, 0 otherwise) and estimate the relationship between screen size, price and manufacturer dummy as a multiple…arrow_forwardHere is data with as the response variable. x y54.4 19.124.9 99.334.5 9.476.6 0.359.4 4.554.4 0.139.2 56.354 15.773.8 9-156.1 319.2Make a scatter plot of this data. Which point is an outlier? Enter as an ordered pair, e.g., (x,y). (x,y)= Find the regression equation for the data set without the outlier. Enter the equation of the form mx+b rounded to three decimal places. y_wo= Find the regression equation for the data set with the outlier. Enter the equation of the form mx+b rounded to three decimal places. y_w=arrow_forward
- You have been hired as an intern to run analyses on the data and report the results back to Sarah; the five questions that Sarah needs you to address are given below. please do it step by step Does there appear to be a positive or negative relationship between price and screen size? Use a scatter plot to examine the relationship. Determine and interpret the correlation coefficient between the two variables. In your interpretation, discuss the direction of the relationship (positive, negative, or zero relationship). Also discuss the strength of the relationship. Estimate the relationship between screen size and price using a simple linear regression model and interpret the estimated coefficients. (In your interpretation, tell the dollar amount by which price will change for each unit of increase in screen size). Include the manufacturer dummy variable (Samsung=1, 0 otherwise) and estimate the relationship between screen size, price and manufacturer dummy as a multiple linear…arrow_forwardExercises: Find all the whole number solutions of the congruence equation. 1. 3x 8 mod 11 2. 2x+3= 8 mod 12 3. 3x+12= 7 mod 10 4. 4x+6= 5 mod 8 5. 5x+3= 8 mod 12arrow_forwardScenario Sales of products by color follow a peculiar, but predictable, pattern that determines how many units will sell in any given year. This pattern is shown below Product Color 1995 1996 1997 Red 28 42 21 1998 23 1999 29 2000 2001 2002 Unit Sales 2003 2004 15 8 4 2 1 2005 2006 discontinued Green 26 39 20 22 28 14 7 4 2 White 43 65 33 36 45 23 12 Brown 58 87 44 48 60 Yellow 37 56 28 31 Black 28 42 21 Orange 19 29 Purple Total 28 42 21 49 68 78 95 123 176 181 164 127 24 179 Questions A) Which color will sell the most units in 2007? B) Which color will sell the most units combined in the 2007 to 2009 period? Please show all your analysis, leave formulas in cells, and specify any assumptions you make.arrow_forward
- One hundred students were surveyed about their preference between dogs and cats. The following two-way table displays data for the sample of students who responded to the survey. Preference Male Female TOTAL Prefers dogs \[36\] \[20\] \[56\] Prefers cats \[10\] \[26\] \[36\] No preference \[2\] \[6\] \[8\] TOTAL \[48\] \[52\] \[100\] problem 1 Find the probability that a randomly selected student prefers dogs.Enter your answer as a fraction or decimal. \[P\left(\text{prefers dogs}\right)=\] Incorrect Check Hide explanation Preference Male Female TOTAL Prefers dogs \[\blueD{36}\] \[\blueD{20}\] \[\blueE{56}\] Prefers cats \[10\] \[26\] \[36\] No preference \[2\] \[6\] \[8\] TOTAL \[48\] \[52\] \[100\] There were \[\blueE{56}\] students in the sample who preferred dogs out of \[100\] total students.arrow_forwardBusiness discussarrow_forwardYou have been hired as an intern to run analyses on the data and report the results back to Sarah; the five questions that Sarah needs you to address are given below. Does there appear to be a positive or negative relationship between price and screen size? Use a scatter plot to examine the relationship. Determine and interpret the correlation coefficient between the two variables. In your interpretation, discuss the direction of the relationship (positive, negative, or zero relationship). Also discuss the strength of the relationship. Estimate the relationship between screen size and price using a simple linear regression model and interpret the estimated coefficients. (In your interpretation, tell the dollar amount by which price will change for each unit of increase in screen size). Include the manufacturer dummy variable (Samsung=1, 0 otherwise) and estimate the relationship between screen size, price and manufacturer dummy as a multiple linear regression model. Interpret the…arrow_forward
arrow_back_ios
SEE MORE QUESTIONS
arrow_forward_ios
Recommended textbooks for you
 Big Ideas Math A Bridge To Success Algebra 1: Stu...AlgebraISBN:9781680331141Author:HOUGHTON MIFFLIN HARCOURTPublisher:Houghton Mifflin Harcourt
 Glencoe Algebra 1, Student Edition, 9780079039897...AlgebraISBN:9780079039897Author:CarterPublisher:McGraw Hill
 Holt Mcdougal Larson Pre-algebra: Student Edition...AlgebraISBN:9780547587776Author:HOLT MCDOUGALPublisher:HOLT MCDOUGAL
Big Ideas Math A Bridge To Success Algebra 1: Stu...
Algebra
ISBN:9781680331141
Author:HOUGHTON MIFFLIN HARCOURT
Publisher:Houghton Mifflin Harcourt
Glencoe Algebra 1, Student Edition, 9780079039897...
Algebra
ISBN:9780079039897
Author:Carter
Publisher:McGraw Hill
Holt Mcdougal Larson Pre-algebra: Student Edition...
Algebra
ISBN:9780547587776
Author:HOLT MCDOUGAL
Publisher:HOLT MCDOUGAL
How to make Frequency Distribution Table / Tally Marks and Frequency Distribution Table; Author: Reenu Math;https://www.youtube.com/watch?v=i_A6RiE8tLE;License: Standard YouTube License, CC-BY
Frequency distribution table in statistics; Author: Math and Science;https://www.youtube.com/watch?v=T7KYO76DoOE;License: Standard YouTube License, CC-BY
Frequency Distribution Table for Grouped/Continuous data | Math Dot Com; Author: Maths dotcom;https://www.youtube.com/watch?v=ErnccbXQOPY;License: Standard Youtube License