
Videos
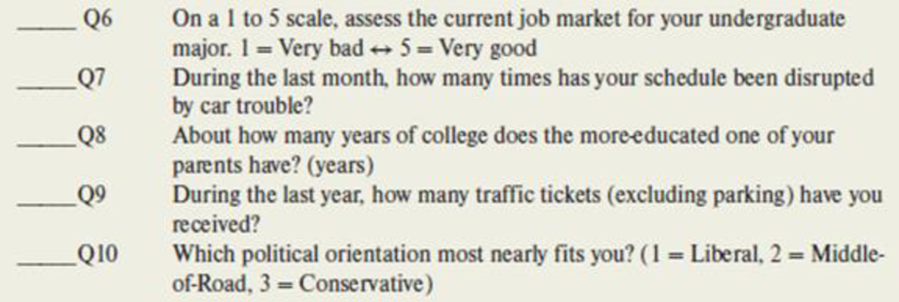
Below are five questions from a survey of MBA students Answers were written in the blank at the left of each question. For each question, state the data type (categorical, discrete numerical, or continuous numerical) and measurement level (nominal, ordinal, interval, ratio). Explain your reasoning. If there is doubt discuss the alternatives.
a.
Identify the data type as categorical, discrete numerical or continuous numerical and the measurement level as nominal, ordinal, interval or ratio for the given question.
Answer to Problem 34CE
The data type of the question “On a 1 to 5 scale, assess the current job market for your undergraduate major.” is categorical.
The question has ordinal measurement level.
Explanation of Solution
A survey is conducted on MBA students. The given question is, “On a 1 to 5 scale, assess the current job market for your undergraduate major. 1 = Very bad
Categorical data:
The type of data that naturally take non-numerical values, such as words that can classify or name the data points based on their quality, are called qualitative or categorical data. In order to facilitate the use of statistical methods on categorical data, a commonly used process used is coding, where each value of the categorical variable is coded or represented using a unique number.
Discrete numerical data:
The type of data that can take a countable number of distinct numerical or quantitative values is called a discrete numerical data.
Continuous numerical data:
The type of data that can take an uncountable or infinite number of numerical or quantitative values within any given interval is called a continuous numerical data.
The perception of an MBA student regarding the job market for their undergraduate major simply classifies or categorizes the parent. It does not take any numerical values naturally. Even if there are numerical values, mathematical operations cannot be applied on such values.
Hence, the data type of the question “On a 1 to 5 scale, assess the current job market for your undergraduate major.” is categorical.
Nominal measurement:
Nominal measurement is the most basic form of measurement that names or categorizes or classifies data. It is the weakest and easiest form of measurement.
Ordinal measurement:
Ordinal measurement is the measurement that ranks the data in a logical manner. It can be used when a natural ordering is present in the data to give the relative position of one object with respect to another. Numerical values can be assigned to the orders of the data, even when the data values are not naturally numerical. The properties of nominal measurement are applicable for ordinal measurement.
Interval measurement:
Interval measurement is the measurement that can be applied to data that naturally occur in the numerical form and counting of these values is logical. This scale of measurement does not have a meaningful “zero” value. However, the difference between any two points on the scale is meaningful. The operations of addition and subtraction on this scale are meaningful. The properties of nominal and ordinal measurements are applicable for interval measurement.
Ratio measurement:
Ratio measurement is the strongest form of measurement that can be applied to data that naturally occur in the numerical form and counting of these values is logical. This scale of measurement has a meaningful “zero” value. The operations of addition, subtraction, multiplication and division on this scale are meaningful. The properties of nominal, ordinal and interval measurements are applicable for ratio measurement.
The perception of an MBA student regarding the job market for their undergraduate major can be ordered from high to low or from low to high. Such perceptions can be ranked and assigned numerical values. However, application of mathematical operations is not logical on these values.
Hence, the question “On a 1 to 5 scale, assess the current job market for your undergraduate major.” has ordinal measurement level.
b.
Identify the data type as categorical, discrete numerical or continuous numerical and the measurement level as nominal, ordinal, interval or ratio for the given question.
Answer to Problem 34CE
The data type of the question “During the last month, how many times has your schedule been disrupted by car trouble?” is discrete numerical.
The question has ratio measurement level.
Explanation of Solution
The given variable is, “During the last month, how many times has your schedule been disrupted by car trouble?”
The number of times that the schedule of a student been disrupted by car trouble takes distinct numerical values, which are countable in nature. This number cannot take a fractional value.
Hence, the data type of the question “During the last month, how many times has your schedule been disrupted by car trouble?” is discrete numerical.
The number of times of disruption can be counted. Moreover, the value zero is also logical as the number of times of disruption faced by a student. The operations of addition, subtraction, multiplication and division can be logically performed on this variable.
Hence, the question “During the last month, how many times has your schedule been disrupted by car trouble?” has ratio measurement level.
c.
Identify the data type as categorical, discrete numerical or continuous numerical and the measurement level as nominal, ordinal, interval or ratio for the given question.
Answer to Problem 34CE
The data type of the question “About how many years of college does the more-educated one of your parents have?” is continuous numerical.
The question has ratio measurement level.
Explanation of Solution
The given variable is, “About how many years of college does the more-educated one of your parents have? (years)”.
The number of years of college education received by the parent of a student can take infinite values within a given interval.
Hence, the data type of the question “About how many years of college does the more-educated one of your parents have?” is continuous numerical.
The number of years can be counted. Moreover, the value zero is also logical as the number of years of college education received by the parent of a student. The operations of addition, subtraction, multiplication and division can be logically performed on this variable.
Hence, the question “About how many years of college does the more-educated one of your parents have?” has ratio measurement level.
d.
Identify the data type as categorical, discrete numerical or continuous numerical and the measurement level as nominal, ordinal, interval or ratio for the given question.
Answer to Problem 34CE
The data type of the question “During the last year, how many traffic tickets (excluding parking) have you received?” is discrete numerical.
The question has ratio measurement level.
Explanation of Solution
The given variable is, “During the last year, how many traffic tickets (excluding parking) have you received?”
The number of traffic tickets received by a student takes distinct numerical values, which are countable in nature. This number cannot take a fractional value.
Hence, the data type of the question “During the last year, how many traffic tickets (excluding parking) have you received?” is discrete numerical.
The number of traffic tickets received can be counted. Moreover, the value zero is also logical as the traffic tickets. The operations of addition, subtraction, multiplication and division can be logically performed on this variable.
Hence, the question “During the last year, how many traffic tickets (excluding parking) have you received?” has ratio measurement level.
e.
Identify the data type as categorical, discrete numerical or continuous numerical and the measurement level as nominal, ordinal, interval or ratio for the given question.
Answer to Problem 34CE
The data type of the question “Which political orientation most nearly fits you?” is categorical.
The question has nominal measurement level.
Explanation of Solution
The given variable is, “Which political orientation most nearly fits you? (1 = Liberal, 2 = Middle-of- Road, 3 = Conservative)”.
The political orientation of a student simply classifies or categorizes the student. It does not take any numerical values naturally.
Hence, the data type of the question “Which political orientation most nearly fits you?” is categorical.
The political orientation of a student classifies or categorizes the student. Even when numbers are assigned to such affiliations, these cannot be ranked in a logical order. Moreover, it is not logical to perform mathematical operations on such numbers.
Hence, the question “Which political orientation most nearly fits you?” has nominal measurement level.
Want to see more full solutions like this?
Chapter 2 Solutions
Loose-leaf For Applied Statistics In Business And Economics


- In Gallup's Annual Consumption Habits Poll, telephone interviews were conducted for a random sample of 1014 adults aged 18 and over. One of the questions was "How many cups of coffee, if any, do you drink on an average day?" The following table shows the results obtained (Gallup website, August 6, 2012). Excel File: data05-23.xls Number of Cups per Day Number of Responses 0 365 264 193 3 4 or more 91 101 Define a random variable x = number of cups of coffee consumed on an average day. Let x = 4 represent four or more cups. Round your answers to four decimal places. a. Develop a probability distribution for x. x 0 1 2 3 4 f(x) b. Compute the expected value of x. cups of coffee c. Compute the variance of x. cups of coffee squared d. Suppose we are only interested in adults that drink at least one cup of coffee on an average day. For this group, let y = the number of cups of coffee consumed on an average day. Compute the expected value of y. Compare it to the expected value of x. The…arrow_forwardIn Gallup's Annual Consumption Habits Poll, telephone interviews were conducted for a random sample of 1014 adults aged 18 and over. One of the questions was "How many cups of coffee, if any, do you drink on an average day?" The following table shows the results obtained (Gallup website, August 6, 2012). Excel File: data05-23.xls Number of Cups per Day Number of Responses 0 365 264 193 2 3 4 or more 91 101 Define a random variable x = number of cups of coffee consumed on an average day. Let x = 4 represent four or more cups. Round your answers to four decimal places. a. Develop a probability distribution for x. x 0 1 2 3 f(x) b. Compute the expected value of x. cups of coffee c. Compute the variance of x. cups of coffee squared d. Suppose we are only interested in adults that drink at least one cup of coffee on an average day. For this group, let y = the number of cups of coffee consumed on an average day. Compute the expected value of y. Compare it to the expected value of x. The…arrow_forwardA technician services mailing machines at companies in the Phoenix area. Depending on the type of malfunction, the service call can take 1, 2, 3, or 4 hours. The different types of malfunctions occur at about the same frequency. Develop a probability distribution for the duration of a service call. Duration of Call x f(x) 1 2 3 4 Which of the following probability distribution graphs accurately represents the data set? Consider the required conditions for a discrete probability function, shown below.Does this probability distribution satisfy equation (5.1)?Does this probability distribution satisfy equation (5.2)? What is the probability a service call will take three hours? A service call has just come in, but the type of malfunction is unknown. It is 3:00 P.M. and service technicians usually get off at 5:00 P.M. What is the probability the service technician will have to work overtime to fix the machine today?arrow_forward
- A psychologist determined that the number of sessions required to obtain the trust of a new patient is either 1, 2, or 3. Let x be a random variable indicating the number of sessions required to gain the patient's trust. The following probability function has been proposed. x f(x) for x = 1, 2, or 3 a. Consider the required conditions for a discrete probability function, shown below. f(x) ≥0 Σf(x) = 1 (5.1) (5.2) Does this probability distribution satisfy equation (5.1)? Select Does this probability distribution satisfy equation (5.2)? Select b. What is the probability that it takes exactly 2 sessions to gain the patient's trust (to 3 decimals)? c. What is the probability that it takes at least 2 sessions to gain the patient's trust (to 3 decimals)?arrow_forwardA technician services mailing machines at companies in the Phoenix area. Depending on the type of malfunction, the service call can take 1, 2, 3, or 4 hours. The different types of malfunctions occur at about the same frequency. Develop a probability distribution for the duration of a service call. Which of the following probability distribution graphs accurately represents the data set? Consider the required conditions for a discrete probability function, shown below.Does this probability distribution satisfy equation (5.1)?Does this probability distribution satisfy equation (5.2)? What is the probability a service call will take three hours? A service call has just come in, but the type of malfunction is unknown. It is 3:00 P.M. and service technicians usually get off at 5:00 P.M. What is the probability the service technician will have to work overtime to fix the machine today?arrow_forwardWest Virginia has one of the highest divorce rates in the nation, with an annual rate of approximately 5 divorces per 1000 people (Centers for Disease Control and Prevention website, January 12, 2012). The Marital Counseling Center, Inc. (MCC) thinks that the high divorce rate in the state may require them to hire additional staff. Working with a consultant, the management of MCC has developed the following probability distribution for x = the number of new clients for marriage counseling for the next year. Excel File: data05-19.xls 10 20 f(x) .05 .10 11 30 40 50 60 .10 .20 .35 .20 a. Is this probability distribution valid? Yes Explain. greater than or equal to 0 f(x) Σf(x) equal to 1 b. What is the probability MCC will obtain more than 30 new clients (to 2 decimals)? c. What is the probability MCC will obtain fewer than 20 new clients (to 2 decimals)? d. Compute the expected value and variance of x. Expected value Variance clients per year squared clients per yeararrow_forward
- Reconsider the patient satisfaction data in Table 1. Fit a multiple regression model using both patient age and severity as the regressors. (a) Test for significance of regression. (b) Test for the individual contribution of the two regressors. Are both regressor variables needed in the model? (c) Has adding severity to the model improved the quality of the model fit? Explain your answer.arrow_forwardThe output voltage of a power supply is assumed to be normally distributed. Sixteen observations taken at random on voltage are as follows: 10.35, 9.30, 10.00, 9.96, 11.65, 12.00, 11.25, 9.58, 11.54, 9.95, 10.28, 8.37, 10.44, 9.25, 9.38, and 10.85. (a) Test the hypothesis that the mean voltage equals 12 V against a two-sided alternative using a = 0.05. (b) Construct a 95% two-sided confidence interval on μ. (c) Test the hypothesis that σ² = 11 using α = 0.05. (d) Construct a 95% two-sided confidence interval on σ. (e) Construct a 95% upper confidence interval on σ. (f) Does the assumption of normality seem reasonable for the output voltage?arrow_forwardAnalyze the residuals from the regression model on the patient satisfaction data from Exercise 3. Comment on the adequacy of the regression model.arrow_forward
- Consider the hypotheses: Hop=po H₁ppo where 2 is known. Derive a general expression for determining the sample size for detecting a true mean of 1μo with probability 1-ẞ if the type I error is a.arrow_forwardSuppose we wish to test the hypotheses: Họ : | = 15 H₁: 15 where we know that o² = 9.0. If the true mean is really 20, what sample size must be used to ensure that the probability of type II error is no greater than 0.10? Assume that a = 0.05.arrow_forwardTable 1 contains the data from a patient satisfaction survey for a group of 25 randomly selected patients at a hospital. In addition to satisfaction, data were collected on patient age and an index that measured the severity of illness. (a) Fit a linear regression model relating satisfaction to patient age. (b) Test for significance of regression. (c) What portion of the total variability is accounted for by the regressor variable age? Table 1: Patient Satisfaction Data Severity Observation Age (21) (x2) Satisfaction (y) 1 55 50 2 46 24 3 30 46 4 35 48 5 59 58 6 61 60 7 74 65 8 38 42 9 27 42 10 51 50 11 53 38 12 41 30 13 37 31 88 14 24 34 15 42 30 16 50 48 17 58 61 18 60 71 19 62 62 20 68 38 21 70 41 22 79 66 23 63 31 24 39 42 25 49 40 BE225222222222222222 68 77 96 80 43 44 26 88 75 57 56 88 102 88 70 43 46 56 59 26 83 75arrow_forward
 Holt Mcdougal Larson Pre-algebra: Student Edition...AlgebraISBN:9780547587776Author:HOLT MCDOUGALPublisher:HOLT MCDOUGAL
 Glencoe Algebra 1, Student Edition, 9780079039897...AlgebraISBN:9780079039897Author:CarterPublisher:McGraw Hill
 Big Ideas Math A Bridge To Success Algebra 1: Stu...AlgebraISBN:9781680331141Author:HOUGHTON MIFFLIN HARCOURTPublisher:Houghton Mifflin Harcourt
 Algebra: Structure And Method, Book 1AlgebraISBN:9780395977224Author:Richard G. Brown, Mary P. Dolciani, Robert H. Sorgenfrey, William L. ColePublisher:McDougal Littell
 Functions and Change: A Modeling Approach to Coll...AlgebraISBN:9781337111348Author:Bruce Crauder, Benny Evans, Alan NoellPublisher:Cengage Learning