
Elementary Statistics Using The Ti-83/84 Plus Calculator, Books A La Carte Edition (5th Edition)
5th Edition
ISBN: 9780134688886
Author: Mario F. Triola
Publisher: PEARSON
expand_more
expand_more
format_list_bulleted
Videos
Textbook Question
Chapter 2, Problem 2CRE
In Exercises 1-6, refer to the data below, which are total home game playing times (hours) for all Major League Baseball teams in a recent year (based on data from Baseball Prospectus).
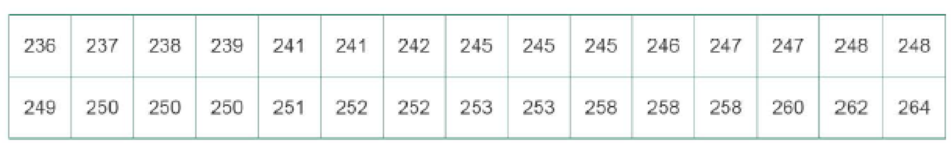
Frequency Distribution For the frequency distribution from Exercise 1, find the following.
- a. Class limits of the first class
- b. Class boundaries of the first class
- c. Class midpoint of the first class
Expert Solution & Answer
Want to see the full answer?
Check out a sample textbook solution
Students have asked these similar questions
8. Suppose that the moments of the random variable X are constant, that is, suppose
that EX" =c for all n ≥ 1, for some constant c. Find the distribution of X.
9. The concentration function of a random variable X is defined as
Qx(h) = sup P(x ≤ X ≤x+h), h>0.
Show that, if X and Y are independent random variables, then
Qx+y (h) min{Qx(h). Qr (h)).
10. Prove that, if (t)=1+0(12) as
asf->>
O is a characteristic function, then p = 1.
Chapter 2 Solutions
Elementary Statistics Using The Ti-83/84 Plus Calculator, Books A La Carte Edition (5th Edition)
Ch. 2.1 - Prob. 1BSCCh. 2.1 - Prob. 2BSCCh. 2.1 - Prob. 3BSCCh. 2.1 - Prob. 4BSCCh. 2.1 - Prob. 5BSCCh. 2.1 - Prob. 6BSCCh. 2.1 - Prob. 7BSCCh. 2.1 - Prob. 8BSCCh. 2.1 - Prob. 9BSCCh. 2.1 - Prob. 10BSC
Ch. 2.1 - Prob. 11BSCCh. 2.1 - Prob. 12BSCCh. 2.1 - Prob. 13BSCCh. 2.1 - Prob. 14BSCCh. 2.1 - Prob. 15BSCCh. 2.1 - Constructing Frequency Distributions. In Exercises...Ch. 2.1 - Constructing Frequency Distributions. In Exercises...Ch. 2.1 - Prob. 18BSCCh. 2.1 - Prob. 19BSCCh. 2.1 - Relative Frequencies for Comparisons. In Exercises...Ch. 2.1 - Prob. 21BSCCh. 2.1 - Prob. 22BSCCh. 2.1 - Prob. 23BSCCh. 2.1 - Prob. 24BSCCh. 2.1 - Large Data Sets. Exercises 2528 involve large sets...Ch. 2.1 - Prob. 26BSCCh. 2.1 - Prob. 27BSCCh. 2.1 - Prob. 28BSCCh. 2.1 - Prob. 29BBCh. 2.2 - Prob. 1BSCCh. 2.2 - Prob. 2BSCCh. 2.2 - Blood Platelet Counts Listed below are blood...Ch. 2.2 - Prob. 4BSCCh. 2.2 - Interpreting a Histogram. In Exercises 5-8, answer...Ch. 2.2 - Prob. 6BSCCh. 2.2 - Prob. 7BSCCh. 2.2 - Prob. 8BSCCh. 2.2 - Prob. 9BSCCh. 2.2 - Constructing Histograms. In Exercises 916,...Ch. 2.2 - Constructing Histograms. In Exercises 916,...Ch. 2.2 - Constructing Histograms. In Exercises 916,...Ch. 2.2 - Prob. 13BSCCh. 2.2 - Prob. 14BSCCh. 2.2 - Prob. 15BSCCh. 2.2 - Prob. 16BSCCh. 2.2 - Prob. 17BBCh. 2.2 - Prob. 18BBCh. 2.3 - Prob. 1BSCCh. 2.3 - Prob. 2BSCCh. 2.3 - Prob. 3BSCCh. 2.3 - Prob. 4BSCCh. 2.3 - Prob. 9BSCCh. 2.3 - Prob. 10BSCCh. 2.3 - Frequency Polygon. In Exercises 15 and 16,...Ch. 2.3 - Frequency Polygon. In Exercises 15 and 16,...Ch. 2.3 - Prob. 17BSCCh. 2.3 - Deceptive Graphs. In Exercises 17-20, identify how...Ch. 2.3 - Prob. 19BSCCh. 2.3 - Deceptive Graphs. In Exercises 17-20, identify how...Ch. 2.4 - Linear Correlation In this section we use r to...Ch. 2.4 - Prob. 2BSCCh. 2.4 - Prob. 3BSCCh. 2.4 - Prob. 4BSCCh. 2.4 - Scatterplot. In Exercises 58, use the sample data...Ch. 2.4 - Prob. 6BSCCh. 2.4 - Prob. 7BSCCh. 2.4 - Prob. 8BSCCh. 2.4 - Prob. 9BSCCh. 2.4 - Linear Correlation Coefficient In Exercises 9-12,...Ch. 2.4 - Prob. 11BSCCh. 2.4 - Prob. 12BSCCh. 2.4 - Prob. 13BBCh. 2.4 - P-Values In Exercises 13-16, write a statement...Ch. 2.4 - Prob. 15BBCh. 2.4 - Prob. 16BBCh. 2 - Cookies Refer to the accompanying frequency...Ch. 2 - Cookies Using the same frequency distribution from...Ch. 2 - Prob. 3CQQCh. 2 - Cookies A stemplot of the same cookies summarized...Ch. 2 - Computers As a quality control manager at Texas...Ch. 2 - Prob. 6CQQCh. 2 - Prob. 7CQQCh. 2 - Prob. 8CQQCh. 2 - Prob. 9CQQCh. 2 - Prob. 10CQQCh. 2 - Frequency Distribution of Body Temperatures...Ch. 2 - Prob. 2RECh. 2 - Prob. 5RECh. 2 - Prob. 6RECh. 2 - Prob. 1CRECh. 2 - In Exercises 1-6, refer to the data below, which...Ch. 2 - Prob. 3CRECh. 2 - Prob. 4CRECh. 2 - Prob. 6CRECh. 2 - Prob. 1TPPCh. 2 - Fast Food Restaurant Drive-Through Service Times:...Ch. 2 - Prob. 2FDDCh. 2 - Fast Food Restaurant Drive-Through Service Times:...Ch. 2 - Prob. 4FDDCh. 2 - Prob. 5FDD
Knowledge Booster


Learn more about
Need a deep-dive on the concept behind this application? Look no further. Learn more about this topic, statistics and related others by exploring similar questions and additional content below.Similar questions
- 9. The concentration function of a random variable X is defined as Qx(h) sup P(x ≤x≤x+h), h>0. (b) Is it true that Qx(ah) =aQx (h)?arrow_forward3. Let X1, X2,..., X, be independent, Exp(1)-distributed random variables, and set V₁₁ = max Xk and W₁ = X₁+x+x+ Isk≤narrow_forward7. Consider the function (t)=(1+|t|)e, ER. (a) Prove that is a characteristic function. (b) Prove that the corresponding distribution is absolutely continuous. (c) Prove, departing from itself, that the distribution has finite mean and variance. (d) Prove, without computation, that the mean equals 0. (e) Compute the density.arrow_forward
- 1. Show, by using characteristic, or moment generating functions, that if fx(x) = ½ex, -∞0 < x < ∞, then XY₁ - Y2, where Y₁ and Y2 are independent, exponentially distributed random variables.arrow_forward1. Show, by using characteristic, or moment generating functions, that if 1 fx(x): x) = ½exarrow_forward1990) 02-02 50% mesob berceus +7 What's the probability of getting more than 1 head on 10 flips of a fair coin?arrow_forward
- 9. The concentration function of a random variable X is defined as Qx(h) sup P(x≤x≤x+h), h>0. = x (a) Show that Qx+b(h) = Qx(h).arrow_forwardSuppose that you buy a lottery ticket, and you have to pick six numbers from 1 through 50 (repetitions allowed). Which combination is more likely to win: 13, 48, 17, 22, 6, 39 or 1, 2, 3, 4, 5, 6? barrow_forward2 Make a histogram from this data set of test scores: 72, 79, 81, 80, 63, 62, 89, 99, 50, 78, 87, 97, 55, 69, 97, 87, 88, 99, 76, 78, 65, 77, 88, 90, and 81. Would a pie chart be appropriate for this data? ganizing Quantitative Data: Charts and Graphs 45arrow_forward
- 10 Meteorologists use computer models to predict when and where a hurricane will hit shore. Suppose they predict that hurricane Stat has a 20 percent chance of hitting the East Coast. a. On what info are the meteorologists basing this prediction? b. Why is this prediction harder to make than your chance of getting a head on your next coin toss? U anoiaarrow_forward6. Show that one cannot find independent, identically distributed random variables X and Y such that X-YE U(-1, 1). 7 Consider al onarrow_forward2 Which situation is more likely to produce exactly 50 percent heads: flipping a coin 10 times or flipping a coin 10,000 times?arrow_forward
arrow_back_ios
SEE MORE QUESTIONS
arrow_forward_ios
Recommended textbooks for you
 Holt Mcdougal Larson Pre-algebra: Student Edition...AlgebraISBN:9780547587776Author:HOLT MCDOUGALPublisher:HOLT MCDOUGAL
 Glencoe Algebra 1, Student Edition, 9780079039897...AlgebraISBN:9780079039897Author:CarterPublisher:McGraw Hill
Holt Mcdougal Larson Pre-algebra: Student Edition...
Algebra
ISBN:9780547587776
Author:HOLT MCDOUGAL
Publisher:HOLT MCDOUGAL
Glencoe Algebra 1, Student Edition, 9780079039897...
Algebra
ISBN:9780079039897
Author:Carter
Publisher:McGraw Hill
How to make Frequency Distribution Table / Tally Marks and Frequency Distribution Table; Author: Reenu Math;https://www.youtube.com/watch?v=i_A6RiE8tLE;License: Standard YouTube License, CC-BY
Frequency distribution table in statistics; Author: Math and Science;https://www.youtube.com/watch?v=T7KYO76DoOE;License: Standard YouTube License, CC-BY
Frequency Distribution Table for Grouped/Continuous data | Math Dot Com; Author: Maths dotcom;https://www.youtube.com/watch?v=ErnccbXQOPY;License: Standard Youtube License