Concept explainers
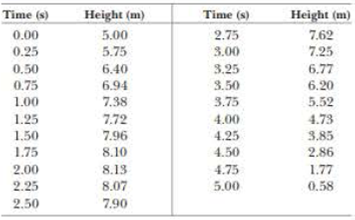
Astronauts on a distant planet toss a rock into the air. With the aid of a camera that takes pictures at a steady rate, they record the rock’s height as a function of time as given in the following table, (a) Find the rock’s average velocity in the time interval between each measurement and the next, (b) Using these average velocities to approximate instantaneous velocities at the midpoints of the lime intervals, make a graph of velocity as a function of time, (c) Does the rock move with constant acceleration? If so, plot a straight line of best fit on the graph and calculate its slope to find the acceleration.

(a)
The average velocity of rock in the time interval between each measurement and the next.
Answer to Problem 2.76AP
The rock’s height as a function of time is shown in below given table.
| Time (s) | Height (m) | Average velocity (
| Midpoint time (s) |
|
|
| ||
|
|
|
|
|
|
|
|
|
|
|
|
|
|
|
|
|
|
|
|
|
|
|
|
|
|
|
|
|
|
|
|
|
|
|
|
|
|
|
|
|
|
|
|
|
|
|
|
|
|
|
|
|
|
|
|
|
|
|
|
|
|
|
|
|
|
|
|
|
|
|
|
|
|
|
|
|
|
|
|
|
|
|
|
|
|
|
|
|
|
|
|
|
|
|
|
|
|
|
|
Table (1)
Explanation of Solution
Given info: The rock’s height as a function of time is shown in below given table.
| Time (s) | Height (m) |
|
|
|
|
|
|
|
|
|
|
|
|
|
|
|
|
|
|
|
|
|
|
|
|
|
|
|
|
|
|
|
|
|
|
|
|
|
|
|
|
|
|
|
|
|
|
|
|
|
|
|
|
|
|
|
|
|
|
|
|
|
|
|
Table (2)
The formula to calculate the average velocity is,
Here,
The formula to calculate the midpoint time is,
Here,
Substitute the values given in table (1) and calculate the average velocity and midpoint time as mentioned in the table.
| Time (s) | Height (m) | Average velocity (
| Midpoint time (s) |
|
|
| ||
|
|
|
|
|
|
|
|
|
|
|
|
|
|
|
|
|
|
|
|
|
|
|
|
|
|
|
|
|
|
|
|
|
|
|
|
|
|
|
|
|
|
|
|
|
|
|
|
|
|
|
|
|
|
|
|
|
|
|
|
|
|
|
|
|
|
|
|
|
|
|
|
|
|
|
|
|
|
|
|
|
|
|
|
|
|
|
|
|
|
|
|
|
|
|
|
|
|
|
|
Table (3)
Conclusion:
Therefore, the rock’s height as a function of time is shown in below given table.
| Time (s) | Height (m) | Average velocity (
| Midpoint time (s) |
|
|
| ||
|
|
|
|
|
|
|
|
|
|
|
|
|
|
|
|
|
|
|
|
|
|
|
|
|
|
|
|
|
|
|
|
|
|
|
|
|
|
|
|
|
|
|
|
|
|
|
|
|
|
|
|
|
|
|
|
|
|
|
|
|
|
|
|
|
|
|
|
|
|
|
|
|
|
|
|
|
|
|
|
|
|
|
|
|
|
|
|
|
|
|
|
|
|
|
|
|
|
|
|
(b)
To draw: The velocity versus time graph.
Answer to Problem 2.76AP
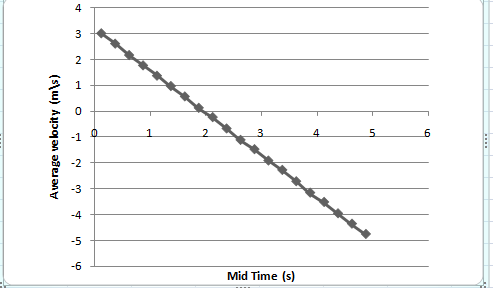
The average velocity versus mid time graph is,

Explanation of Solution
Introduction:
The velocity is defined as rate of change of position of the object. The Midpoint time is the mean of the time interval taken for which position of the object is defined. Plot the difference of the position with respect to midpoint time to obtain velocity time graph.
From part (a) make a graph using values of average velocity and mid time from table (1) as shown below.

Figure (1)
Conclusion:
Therefore, the average velocity versus mid time graph is,

(c)
Whether the rock moves with constant acceleration and determine the acceleration.
Answer to Problem 2.76AP
The rock moves with constant acceleration and the acceleration is
Explanation of Solution
The formula to calculate speed of rock from its graph in figure (1) is,
Substitute
Thus the slope of curve is
Hence, the acceleration of rock is
Conclusion:
Therefore, the rock moves with constant acceleration and the acceleration is
Want to see more full solutions like this?
Chapter 2 Solutions
EBK PHYSICS FOR SCIENTISTS AND ENGINEER
Additional Science Textbook Solutions
Campbell Essential Biology (7th Edition)
College Physics: A Strategic Approach (3rd Edition)
Fundamentals of Physics Extended
Chemistry: Structure and Properties (2nd Edition)
General, Organic, and Biological Chemistry - 4th edition
Cosmic Perspective Fundamentals
- The 10-lb weight is supported by the cord AC and roller and by the spring that has a stiffness of k = 10 lb/in. and an unstretched length of 12 in. as shown in. Part A Determine the distance d to maintain equilibrium. Express your answer in inches to three significant figures. 節 ΕΠΙ ΑΣΦ d = *k J vec 5 t 0 ? d C A in. 12 in. Barrow_forwardThe members of a truss are connected to the gusset plate as shown in . The forces are concurrent at point O. Take = 90° and T₁ = 7.5 kN. Part A Determine the magnitude of F for equilibrium. Express your answer to three significant figures and include the appropriate units. F = Value Submit Request Answer Part B 0 ? Units Determine the magnitude of T2 for equilibrium. Express your answer to three significant figures and include the appropriate units. ? T₂ = Value Units T₁ Carrow_forwardpls help on botharrow_forward
- pls helparrow_forwardpls helparrow_forward6. 6. There are 1000 turns on the primary side of a transformer and 200 turns on thesecondary side. If 440 V are supplied to the primary winding, what is the voltageinduced in the secondary winding? Is this a step-up or step-down transformer? 7. 80 V are supplied to the primary winding of a transformer that has 50 turns. If thesecondary side has 50,000 turns, what is the voltage induced on the secondary side?Is this a step-up or step-down transformer? 8. There are 50 turns on the primary side of a transformer and 500 turns on thesecondary side. The current through the primary winding is 6 A. What is the turnsratio of this transformer? What is the current, in milliamps, through the secondarywinding?9. The current through the primary winding on a transformer is 5 A. There are 1000turns on the primary winding and 20 turns on the secondary winding. What is theturns ratio of this transformer? What is the current, in amps, through the secondarywinding?arrow_forward
- No chatgpt plsarrow_forwardWhat is the current, in amps, across a conductor that has a resistance of10 Ω and a voltage of 20 V? 2. A conductor draws a current of 100 A and a resistance of 5 Ω. What is thevoltageacross the conductor? 3. What is the resistance, in ohm’s, of a conductor that has a voltage of 80 kVand acurrent of 200 mA? 4. An x-ray imaging system that draws a current of 90 A is supplied with 220V. What is the power consumed? 5. An x-ray is produced using 800 mA and 100 kV. What is the powerconsumed in kilowatts?arrow_forwardՍՈՈՒ XVirginia Western Community Coll x P Course Home X + astering.pearson.com/?courseld=13289599#/ Figure y (mm) x=0x = 0.0900 m All ✓ Correct For either the time for one full cycle is 0.040 s; this is the period. Part C - ON You are told that the two points x = 0 and x = 0.0900 m are within one wavelength of each other. If the wave is moving in the +x-direction, determine the wavelength. Express your answer to two significant figures and include the appropriate units. 0 t(s) λ = Value m 0.01 0.03 0.05 0.07 Copyright © 2025 Pearson Education Inc. All rights reserved. 日 F3 F4 F5 1775 % F6 F7 B F8 Submit Previous Answers Request Answer ? × Incorrect; Try Again; 3 attempts remaining | Terms of Use | Privacy Policy | Permissions | Contact Us | Cookie Settings 28°F Clear 4 9:23 PM 1/20/2025 F9 prt sc F10 home F11 end F12 insert delete 6 7 29 & * ( 8 9 0 t = back Οarrow_forward
- Part C Find the height yi from which the rock was launched. Express your answer in meters to three significant figures. Learning Goal: To practice Problem-Solving Strategy 4.1 for projectile motion problems. A rock thrown with speed 12.0 m/s and launch angle 30.0 ∘ (above the horizontal) travels a horizontal distance of d = 19.0 m before hitting the ground. From what height was the rock thrown? Use the value g = 9.800 m/s2 for the free-fall acceleration. PROBLEM-SOLVING STRATEGY 4.1 Projectile motion problems MODEL: Is it reasonable to ignore air resistance? If so, use the projectile motion model. VISUALIZE: Establish a coordinate system with the x-axis horizontal and the y-axis vertical. Define symbols and identify what the problem is trying to find. For a launch at angle θ, the initial velocity components are vix=v0cosθ and viy=v0sinθ. SOLVE: The acceleration is known: ax=0 and ay=−g. Thus, the problem becomes one of…arrow_forwardPhys 25arrow_forwardPhys 22arrow_forward
 University Physics Volume 1PhysicsISBN:9781938168277Author:William Moebs, Samuel J. Ling, Jeff SannyPublisher:OpenStax - Rice University
 Principles of Physics: A Calculus-Based TextPhysicsISBN:9781133104261Author:Raymond A. Serway, John W. JewettPublisher:Cengage Learning
 Physics for Scientists and Engineers with Modern ...PhysicsISBN:9781337553292Author:Raymond A. Serway, John W. JewettPublisher:Cengage Learning
 An Introduction to Physical SciencePhysicsISBN:9781305079137Author:James Shipman, Jerry D. Wilson, Charles A. Higgins, Omar TorresPublisher:Cengage Learning
 College PhysicsPhysicsISBN:9781938168000Author:Paul Peter Urone, Roger HinrichsPublisher:OpenStax College
 Glencoe Physics: Principles and Problems, Student...PhysicsISBN:9780078807213Author:Paul W. ZitzewitzPublisher:Glencoe/McGraw-Hill


