
Concept explainers
Videos
Using a random number generator create a sample of four relative densities using the PDF presented in Figure 2.2. Repeat the exercise to create three different sample sets. Compute the mean and standard deviation of your sample. Compute the mean and standard deviation of each sample set. Compare the means and standard deviations of your samples with each other and with the mean and standard deviation of the original distribution. Discuss the differences among the sample sets and the original distribution, including the type of uncertainties you are dealing with. How many samples do you think are needed to reliably determine the mean and standard deviation of the relative density of this particular soil?
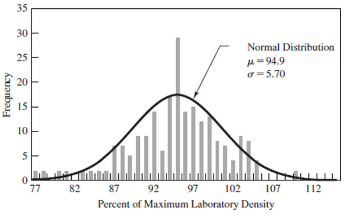
Figure 2.2
Histogram and the corresponding normal distribution of dry unit weight of a compacted soil at a road site in Los Alamos, New Mexico.

Learn your wayIncludes step-by-step video

Chapter 2 Solutions
Foundation Design: Principles and Practices (3rd Edition)
Additional Engineering Textbook Solutions
Starting Out with Programming Logic and Design (5th Edition) (What's New in Computer Science)
Starting Out With Visual Basic (8th Edition)
Computer Science: An Overview (13th Edition) (What's New in Computer Science)
Starting Out with Python (4th Edition)
Starting Out with C++ from Control Structures to Objects (9th Edition)
Modern Database Management


- YOU HAVE SET YOUR LEVEL UP AND ARE UTILIZING CP-101 ELEVATION FOR YOUR BENCHMARK AND HAVE THE FOLLOWING READING:CP-101=6.02YOUR FORM ELEVATION READINGS ("ATTACHED")( BEGINNING AT THE NORTHEAST BUILDING CORNER)AND WORKING IN A CLOCKWISE DIRECTION CHECKING THE BUILDING CORNER FORMSARE AS FOLLOWS: (CALCULATE THE ELEVATIONS OF 1-6 BELOW) 1. NE COR. = 1.152. SE COR. = 1.153. SW COR. = 1.354. (N) SW COR. = 1.155. INTERIOR = 1.306. NW COR. = 1.15arrow_forwarda) A 14-ft. tall and12-ft.-8-in. long fully grouted reinforced masonry wall is constructed of 8-in.CMU. It is to be analyzed for out-of-plane loading. Construct thenP -nM curves for the wallwith the following three vertical reinforcement scenarios: (1) 10 No. 6 bars at 16 in. spacing,(2) 10 No. 5 bars at 16 in. spacing, and (3) 7 No. 4 bars at 24 in. spacing. The steel is Grade60 with a modulus of elasticity of 29,000 ksi, and the masonry has a compressive strength of2,000 psi. You may use Excel or Matlab to construct the curves. Also, show the maximumnPallowed by the code for each case.(b) For each of the above reinforcement scenarios, determine the maximum axial loads that arepermitted for the tension-controlled condition and transition condition.(c) Discuss how the amount of vertical reinforcement affects thenPn - Mn curve.arrow_forwardIf you could help me answer these questions in matlab that would be great, I provided an additional picture detailing what the outcome should look like.arrow_forward
- A fully grouted reinforced masonry wall is to be constructed of 8-in. CMU. The wall height is 18feet. It is assumed to be simply supported. The wall is to be designed for an out-of-plane seismicload of 52 lbs./ft.2, which can act in either direction. The wall also supports a roof dead load of600 lbs./ft. and a roof live load of 300 lbs./ft. along the wall length. The roof loads have aneccentricity of 2.5 inches. Since there is seismic load, load combinations (6) and (7) in Chapter 2of ASCE 7-22 should be considered. In these two load combinations,horizontal seismic loadhE =andvertical seismic loadvE = . You may ignorevE in this problem for simplicity. The masonryhas a specified compressive strength of 2,500 psi. (a) Use the strength design provisions of TMS402 to determine the size and spacing of the vertical bars needed. Use the P-δ analysis method inSection 9.3.4.4.2 of TMS 402 to determine Mu. (b) Repeat the design using the momentmagnification method in Section 9.3.4.4.3 instead.arrow_forwardThe factor of safety for tipping of the concrete dam is defined as the ratio of the stabilizing moment due to the dam's weight divided by the overturning moment about OO due to the water pressure (Figure 1). Suppose that aa = 5 mm , dd = 2 mm , hh = 7 mm . The concrete has a density of ρconcρconc = 2.5 Mg/m3Mg/m3 and for water ρwρw = 1 Mg/m3Mg/m3arrow_forwardcan you answer both plss, i will give u a likearrow_forward
- *1-4. The hollow core panel is made from plain stone concrete. Determine the dead weight of the panel. The holes each have a diameter of 100 mm. 200 mm 300 mm 300 mm 300 mm 300 mm 300 mm Prob. 1-4 300 mm 4 marrow_forwardderive the expressions for V and M, and draw the shear forceandbendingmomentdiagrams.Neglecttheweightofthebeam.arrow_forwarda. Draw trajectories of approximately 8 to 11 vehicles moving on a one way 1-lane road with different time-varying speeds. b. Consider a time-space window in the time-space diagram of part (a). See below. Denote the number of vehicles passing BD, DC, AC, and AB respectively as n1, N2, N3, and n4. Write an equation relating n₁, N2, N3, and n4 to each other. What is the physical intuition of this equation? Please elaborate. X 4 X. n4 n3 с n2 X1 D B n1 t c. Using density (k) definition at time instances t₁ and t₂ and flow (q) definition at locations X1 and X2, rewrite equation of interest in part (b) to demonstrate KAB-KCD 9BD-9AC + t₂-t1 x2-x1 = 0. d. What will be the equation in part (c), in case of x2 → x1 and t₂ → t₁.arrow_forward
- Consider a city center where the traffic conditions are described by a Macroscopic Fundamental Diagram (MFD) of network outflow (g- rate of trips finished) vs. accumulation (n- number of cars) with a trapezoidal shape, as shown in the figure below. The values of the parameters are: • • maximum trip completion rate gmax=100 [veh/min] critical accumulations ncr1=1000 [veh] and ncr2=1500 [veh] jam accumulation njam=4000 [veh]. gmax ncr1 ncr2 njam There are two types of demands in the morning peak hour (7-8am): trips generated from outside the city center with rate q1=80 [veh/min], and trips generated from within the city center with rate q2=50 [veh/min]. In addition, a perimeter traffic control, u, is available that only restricts vehicles entering the city from outside. If at 7am there are already no=500 [veh] in the city center: a. Write the dynamic equations (mass conservation equation) in a continuous form for the center of the city. b. Convert the continuous dynamic into the discrete…arrow_forwardAssume a car park facility where the arrival rate is 1 customer every minute, and the service process including pressing the button, taking the card, and waiting for the boom to rise leads to service rate of μ customer every minute. a. Assume the arrival and service processes are stochastic. Using any software (Excel, Matlab, or the one you prefer), plot average delay time (including service time) and average queue size (including the vehicle currently being served) for all combinations of λ = {1,2,3,..,10} and p = {0.1,0.3,0.5,0.7,0.9}. Specifically, we ask you to make 2 graphs (one for average delay and the other for average queue size), where the x-axes contains the different values for 1, and where you make one curve for each p. b. Assume the arrival process is stochastic but the service process is deterministic with rate μ. Using any software (Excel, Matlab, or the one you prefer), plot average delay time (including service time) and average queue size (including the vehicle…arrow_forwardA traffic signal has a 60-second cycle length (Red time + Green time). For the travel direction of interest, the red and green times are 30 seconds each, the arrival rate is constant at 20 [veh/min] and the saturation flow (i.e., the departure rate) is 1 [veh/sec]. a. Calculate the average delay (for all vehicles) for the travel direction of interest. b. Assume a work zone on the street downstream of the intersection so that only 25 [veh/min] (in the direction of interest) can pass. Calculate the average delay caused by the work zone to a vehicle leaving the intersection. Assume that the queue at the work zone never backs- up into the intersection. c. Discuss qualitatively the implications of queue spillback from the work zone on the delay of the system. Traffic Direction (a) Traffic Direction (b)arrow_forward
 Engineering Fundamentals: An Introduction to Engi...Civil EngineeringISBN:9781305084766Author:Saeed MoaveniPublisher:Cengage Learning
 Materials Science And Engineering PropertiesCivil EngineeringISBN:9781111988609Author:Charles GilmorePublisher:Cengage Learning
 Fundamentals of Geotechnical Engineering (MindTap...Civil EngineeringISBN:9781305635180Author:Braja M. Das, Nagaratnam SivakuganPublisher:Cengage Learning