
STATISTICAL TECHNIQUES-ACCESS ONLY
16th Edition
ISBN: 9780077639648
Author: Lind
Publisher: MCG
expand_more
expand_more
format_list_bulleted
Videos
Textbook Question
Chapter 2, Problem 21E
The frequency distribution representing the number of frequent flier miles accumulated by employees at Brumley Statistical Consulting Inc. is repeated from Exercise 17.
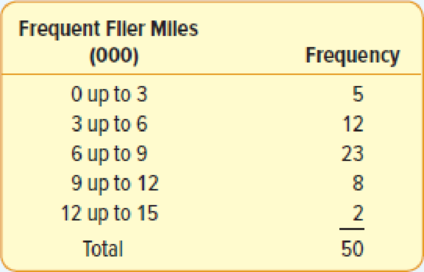
- a. How many employees accumulated less than 3,000 miles?
- b. Convert the frequency distribution to a cumulative frequency distribution.
- c. Portray the cumulative distribution in the form of a cumulative frequency
polygon . - d. Based on the cumulative relative frequencies, about 75% of the employees accumulated how many miles or less?
Expert Solution & Answer
Want to see the full answer?
Check out a sample textbook solution
Students have asked these similar questions
The average miles per gallon for a sample of 40 cars of model SX last year was 32.1, with a population standard deviation of 3.8. A sample of 40 cars from this year’s model SX has an average of 35.2 mpg, with a population standard deviation of 5.4.
Find a 99 percent confidence interval for the difference in average mpg for this car brand (this year’s model minus last year’s).Find a 99 percent confidence interval for the difference in average mpg for last year’s model minus this year’s. What does the negative difference mean?
A special interest group reports a tiny margin of error (plus or minus 0.04 percent) for its online survey based on 50,000 responses. Is the margin of error legitimate? (Assume that the group’s math is correct.)
Suppose that 73 percent of a sample of 1,000 U.S. college students drive a used car as opposed to a new car or no car at all.
Find an 80 percent confidence interval for the percentage of all U.S. college students who drive a used car.What sample size would cut this margin of error in half?
Chapter 2 Solutions
STATISTICAL TECHNIQUES-ACCESS ONLY
Ch. 2 - DeCenzo Specialty Food and Beverage Company has...Ch. 2 - A pie chart shows the relative market share of...Ch. 2 - In a marketing study, 100 consumers were asked to...Ch. 2 - A total of 1,000 residents in Minnesota were asked...Ch. 2 - Two thousand frequent business travelers are asked...Ch. 2 - Wellstone Inc. produces and markets replacement...Ch. 2 - A small business consultant is investigating the...Ch. 2 - In the first quarter of last year, the 11 members...Ch. 2 - Prob. 3SRCh. 2 - A set of data consists of 38 observations. How...
Ch. 2 - A set of data consists of 45 observations between...Ch. 2 - A set of data consists of 230 observations between...Ch. 2 - A set of data contains 53 observations. The...Ch. 2 - Wachesaw Manufacturing Inc. produced the following...Ch. 2 - The Quick Change Oil Company has a number of...Ch. 2 - The manager of the BiLo Supermarket in Mt....Ch. 2 - The food services division of Cedar River...Ch. 2 - The annual imports of a selected group of...Ch. 2 - Mollys Candle Shop has several retail stores in...Ch. 2 - The following chart shows the number of patients...Ch. 2 - The following frequency distribution reports the...Ch. 2 - Ecommerce.com, a large Internet retailer, is...Ch. 2 - A sample of the hourly wages of 15 employees at...Ch. 2 - The following cumulative frequency and the...Ch. 2 - The cumulative frequency and the cumulative...Ch. 2 - The frequency distribution representing the number...Ch. 2 - The frequency distribution of order lead time at...Ch. 2 - Describe the similarities and differences of...Ch. 2 - Describe the similarities and differences between...Ch. 2 - Alexandra Damonte will be building a new resort in...Ch. 2 - Speedy Swift is a package delivery service that...Ch. 2 - A data set consists of 83 observations. How many...Ch. 2 - A data set consists of 145 observations that range...Ch. 2 - The following is the number of minutes to commute...Ch. 2 - The following data give the weekly amounts spent...Ch. 2 - A social scientist is studying the use of iPods by...Ch. 2 - David Wise handles his own investment portfolio,...Ch. 2 - You are exploring the music in your iTunes...Ch. 2 - The monthly issues of the Journal of Finance are...Ch. 2 - The following histogram shows the scores on the...Ch. 2 - The following chart summarizes the selling price...Ch. 2 - A chain of sport shops catering to beginning...Ch. 2 - The numbers of outstanding shares for 24 publicly...Ch. 2 - A recent survey showed that the typical American...Ch. 2 - Midland National Bank selected a sample of 40...Ch. 2 - Residents of the state of South Carolina earned a...Ch. 2 - A recent study of home technologies reported the...Ch. 2 - Merrill Lynch recently completed a study regarding...Ch. 2 - A total of 5.9% of the prime-time viewing audience...Ch. 2 - Refer to the following chart: a. What is the name...Ch. 2 - The following chart depicts the annual revenues,...Ch. 2 - In 2011, the United States exported a total of 281...Ch. 2 - In the United States, the industrial revolution of...Ch. 2 - One of the most popular candies in the United...Ch. 2 - The number of families who used the Minneapolis...Ch. 2 - Refer to the Real Estate data, which reports...Ch. 2 - Refer to the Baseball 2012 data that report...Ch. 2 - Prob. 53DE
Knowledge Booster


Learn more about
Need a deep-dive on the concept behind this application? Look no further. Learn more about this topic, statistics and related others by exploring similar questions and additional content below.Similar questions
- You want to compare the average number of tines on the antlers of male deer in two nearby metro parks. A sample of 30 deer from the first park shows an average of 5 tines with a population standard deviation of 3. A sample of 35 deer from the second park shows an average of 6 tines with a population standard deviation of 3.2. Find a 95 percent confidence interval for the difference in average number of tines for all male deer in the two metro parks (second park minus first park).Do the parks’ deer populations differ in average size of deer antlers?arrow_forwardSuppose that you want to increase the confidence level of a particular confidence interval from 80 percent to 95 percent without changing the width of the confidence interval. Can you do it?arrow_forwardA random sample of 1,117 U.S. college students finds that 729 go home at least once each term. Find a 98 percent confidence interval for the proportion of all U.S. college students who go home at least once each term.arrow_forward
- Suppose that you make two confidence intervals with the same data set — one with a 95 percent confidence level and the other with a 99.7 percent confidence level. Which interval is wider?Is a wide confidence interval a good thing?arrow_forwardIs it true that a 95 percent confidence interval means you’re 95 percent confident that the sample statistic is in the interval?arrow_forwardTines can range from 2 to upwards of 50 or more on a male deer. You want to estimate the average number of tines on the antlers of male deer in a nearby metro park. A sample of 30 deer has an average of 5 tines, with a population standard deviation of 3. Find a 95 percent confidence interval for the average number of tines for all male deer in this metro park.Find a 98 percent confidence interval for the average number of tines for all male deer in this metro park.arrow_forward
- Based on a sample of 100 participants, the average weight loss the first month under a new (competing) weight-loss plan is 11.4 pounds with a population standard deviation of 5.1 pounds. The average weight loss for the first month for 100 people on the old (standard) weight-loss plan is 12.8 pounds, with population standard deviation of 4.8 pounds. Find a 90 percent confidence interval for the difference in weight loss for the two plans( old minus new) Whats the margin of error for your calculated confidence interval?arrow_forwardA 95 percent confidence interval for the average miles per gallon for all cars of a certain type is 32.1, plus or minus 1.8. The interval is based on a sample of 40 randomly selected cars. What units represent the margin of error?Suppose that you want to decrease the margin of error, but you want to keep 95 percent confidence. What should you do?arrow_forward3. (i) Below is the R code for performing a X2 test on a 2×3 matrix of categorical variables called TestMatrix: chisq.test(Test Matrix) (a) Assuming we have a significant result for this procedure, provide the R code (including any required packages) for an appropriate post hoc test. (b) If we were to apply this technique to a 2 × 2 case, how would we adapt the code in order to perform the correct test? (ii) What procedure can we use if we want to test for association when we have ordinal variables? What code do we use in R to do this? What package does this command belong to? (iii) The following code contains the initial steps for a scenario where we are looking to investigate the relationship between age and whether someone owns a car by using frequencies. There are two issues with the code - please state these. Row3<-c(75,15) Row4<-c(50,-10) MortgageMatrix<-matrix(c(Row1, Row4), byrow=T, nrow=2, MortgageMatrix dimnames=list(c("Yes", "No"), c("40 or older","<40")))…arrow_forward
- Describe the situation in which Fisher’s exact test would be used?(ii) When do we use Yates’ continuity correction (with respect to contingencytables)?[2 Marks] 2. Investigate, checking the relevant assumptions, whether there is an associationbetween age group and home ownership based on the sample dataset for atown below:Home Owner: Yes NoUnder 40 39 12140 and over 181 59Calculate and evaluate the effect size.arrow_forwardNot use ai pleasearrow_forwardNeed help with the following statistic problems.arrow_forward
arrow_back_ios
SEE MORE QUESTIONS
arrow_forward_ios
Recommended textbooks for you
 Holt Mcdougal Larson Pre-algebra: Student Edition...AlgebraISBN:9780547587776Author:HOLT MCDOUGALPublisher:HOLT MCDOUGAL
 College Algebra (MindTap Course List)AlgebraISBN:9781305652231Author:R. David Gustafson, Jeff HughesPublisher:Cengage Learning
 Big Ideas Math A Bridge To Success Algebra 1: Stu...AlgebraISBN:9781680331141Author:HOUGHTON MIFFLIN HARCOURTPublisher:Houghton Mifflin Harcourt
 Glencoe Algebra 1, Student Edition, 9780079039897...AlgebraISBN:9780079039897Author:CarterPublisher:McGraw Hill
 Functions and Change: A Modeling Approach to Coll...AlgebraISBN:9781337111348Author:Bruce Crauder, Benny Evans, Alan NoellPublisher:Cengage Learning
 Algebra: Structure And Method, Book 1AlgebraISBN:9780395977224Author:Richard G. Brown, Mary P. Dolciani, Robert H. Sorgenfrey, William L. ColePublisher:McDougal Littell
Holt Mcdougal Larson Pre-algebra: Student Edition...
Algebra
ISBN:9780547587776
Author:HOLT MCDOUGAL
Publisher:HOLT MCDOUGAL
College Algebra (MindTap Course List)
Algebra
ISBN:9781305652231
Author:R. David Gustafson, Jeff Hughes
Publisher:Cengage Learning
Big Ideas Math A Bridge To Success Algebra 1: Stu...
Algebra
ISBN:9781680331141
Author:HOUGHTON MIFFLIN HARCOURT
Publisher:Houghton Mifflin Harcourt
Glencoe Algebra 1, Student Edition, 9780079039897...
Algebra
ISBN:9780079039897
Author:Carter
Publisher:McGraw Hill
Functions and Change: A Modeling Approach to Coll...
Algebra
ISBN:9781337111348
Author:Bruce Crauder, Benny Evans, Alan Noell
Publisher:Cengage Learning
Algebra: Structure And Method, Book 1
Algebra
ISBN:9780395977224
Author:Richard G. Brown, Mary P. Dolciani, Robert H. Sorgenfrey, William L. Cole
Publisher:McDougal Littell
How to make Frequency Distribution Table / Tally Marks and Frequency Distribution Table; Author: Reenu Math;https://www.youtube.com/watch?v=i_A6RiE8tLE;License: Standard YouTube License, CC-BY
Frequency distribution table in statistics; Author: Math and Science;https://www.youtube.com/watch?v=T7KYO76DoOE;License: Standard YouTube License, CC-BY
Frequency Distribution Table for Grouped/Continuous data | Math Dot Com; Author: Maths dotcom;https://www.youtube.com/watch?v=ErnccbXQOPY;License: Standard Youtube License