Concept explainers
Videos
(a) Use the data in Problem 3 to construct a smooth graph of position versus time. (b) By constructing tangents to the x(t) curve, find the instantaneous velocity of the car at several instants. (c) Plot the instantaneous velocity versus time and, from this information, determine the average acceleration of the car. (d) What was the initial velocity of the car?
(a)
The graph of position versus time.
Answer to Problem 2.18P
Therefore, the smooth graph of position versus time is shown in Figure I.
Explanation of Solution
The following table contains the data of position of the car at various time instants.
Draw the graph of position versus time for the derby car.
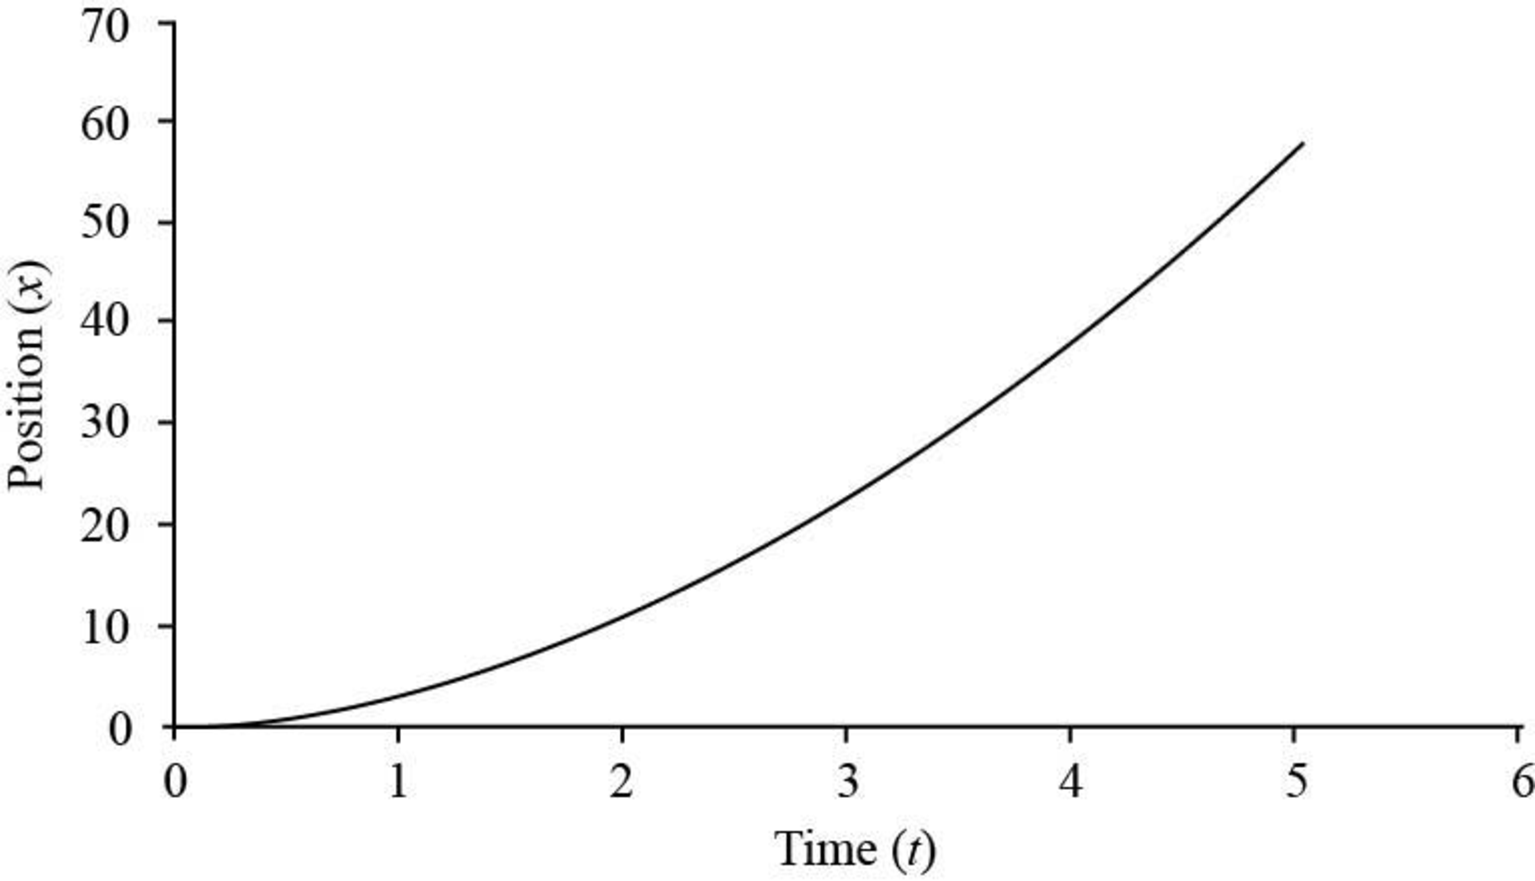
Figure I
In the shown graph, the position of the car at various time instants is plotted in the vertical axis against the time along horizontal direction.
Conclusion:
Therefore, the smooth graph of position versus time is shown in Figure I.
(b)
The instantaneous velocity of the car at various time instants.
Answer to Problem 2.18P
The instantaneous velocity of the car at
Explanation of Solution
The following table contains the data of position of the car at various time instants.
The instantaneous velocity is the slope of the tangent of the position versus time graph at an instant.
Formula to calculate the slope of the tangent is,
Here,
Draw the tangent line at the time instant of
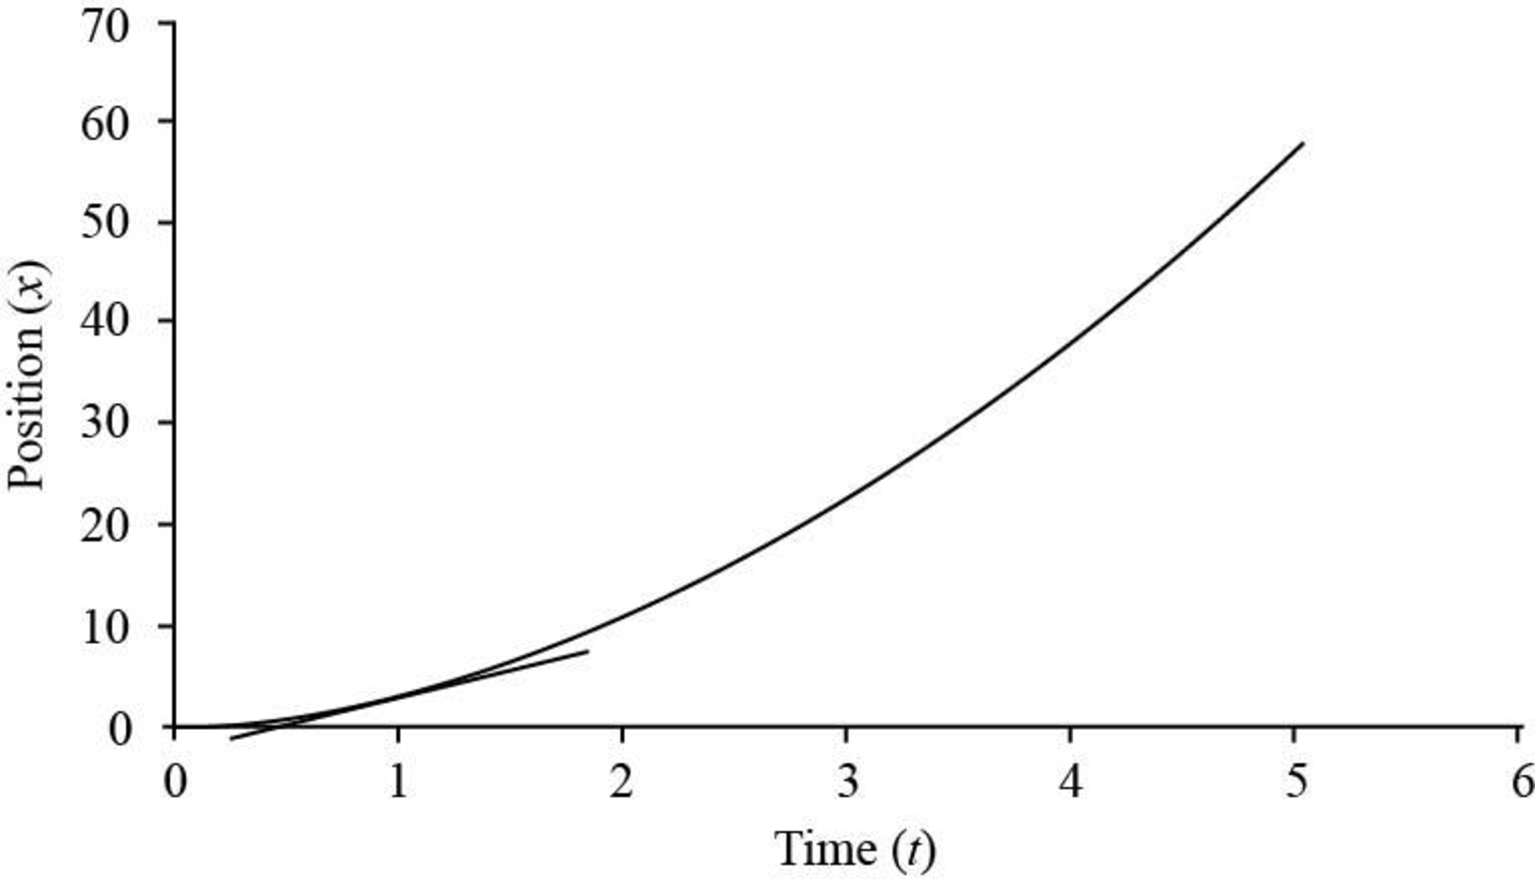
Figure II
Substitute
Therefore, the instantaneous velocity of the car at
Draw the tangent line at the time instant of
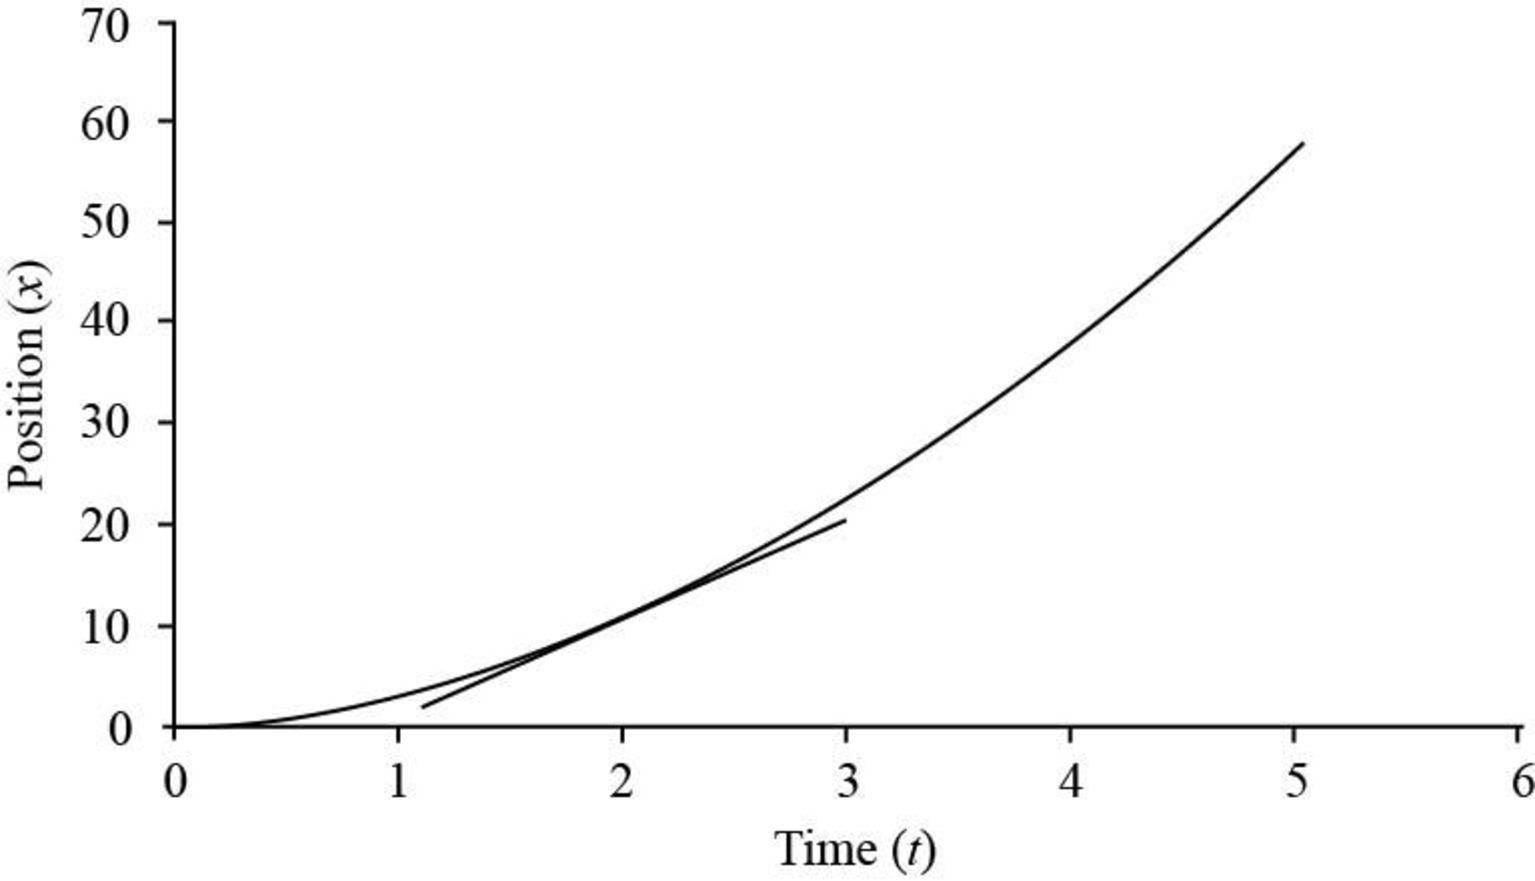
Figure III
Substitute
Therefore, the instantaneous velocity of the car at
Draw the tangent line at the time instant of
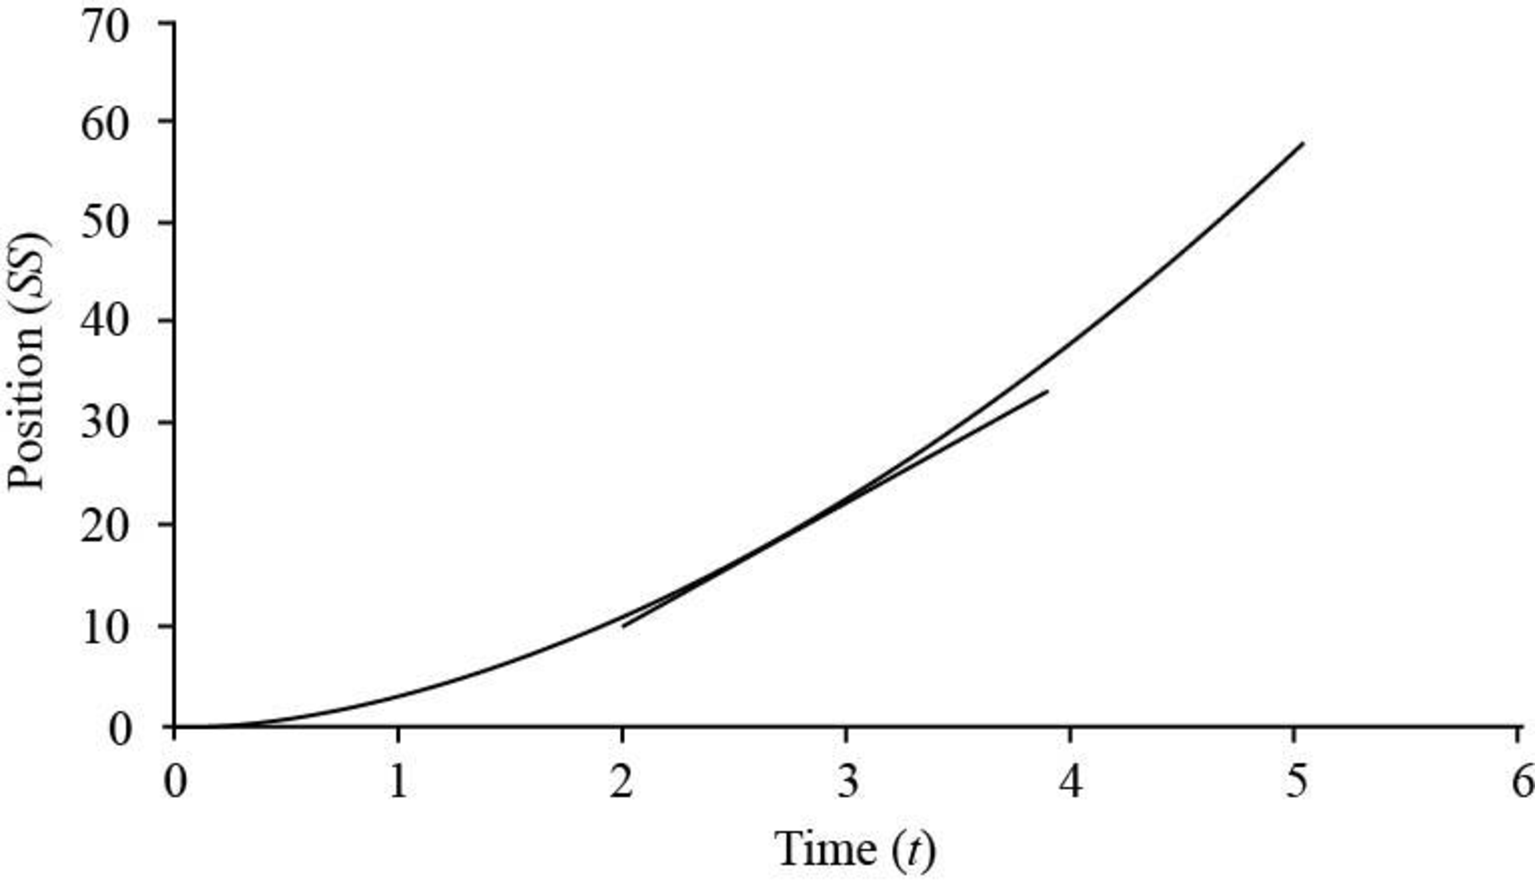
Figure IV
Substitute
Therefore, the instantaneous velocity of the car at
Draw the tangent line at the time instant of
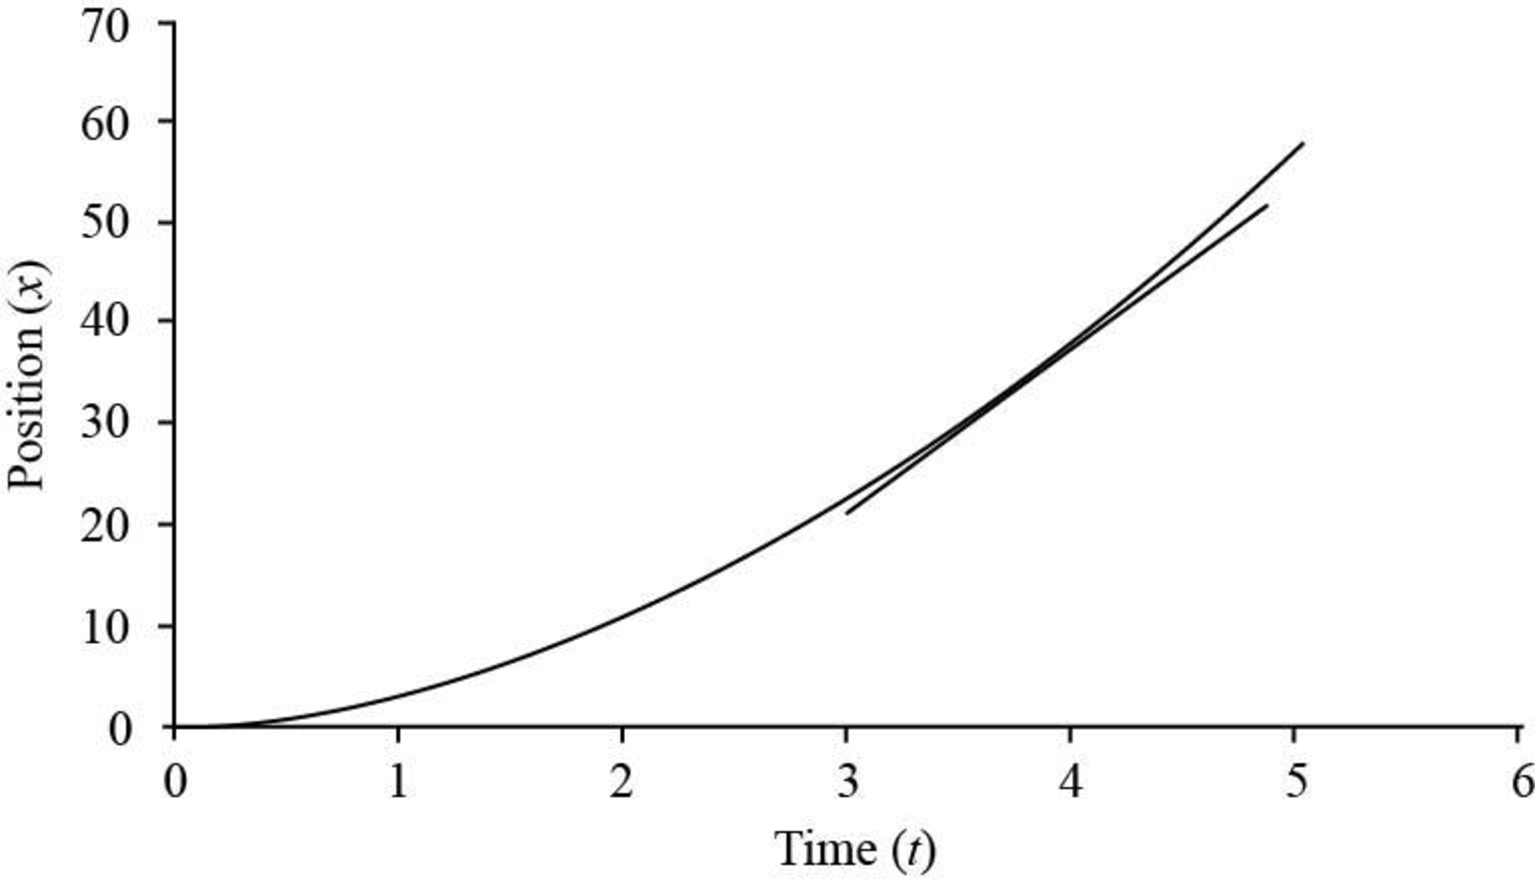
Figure V
Substitute
Therefore, the instantaneous velocity of the car at
Draw the tangent line at the time instant of
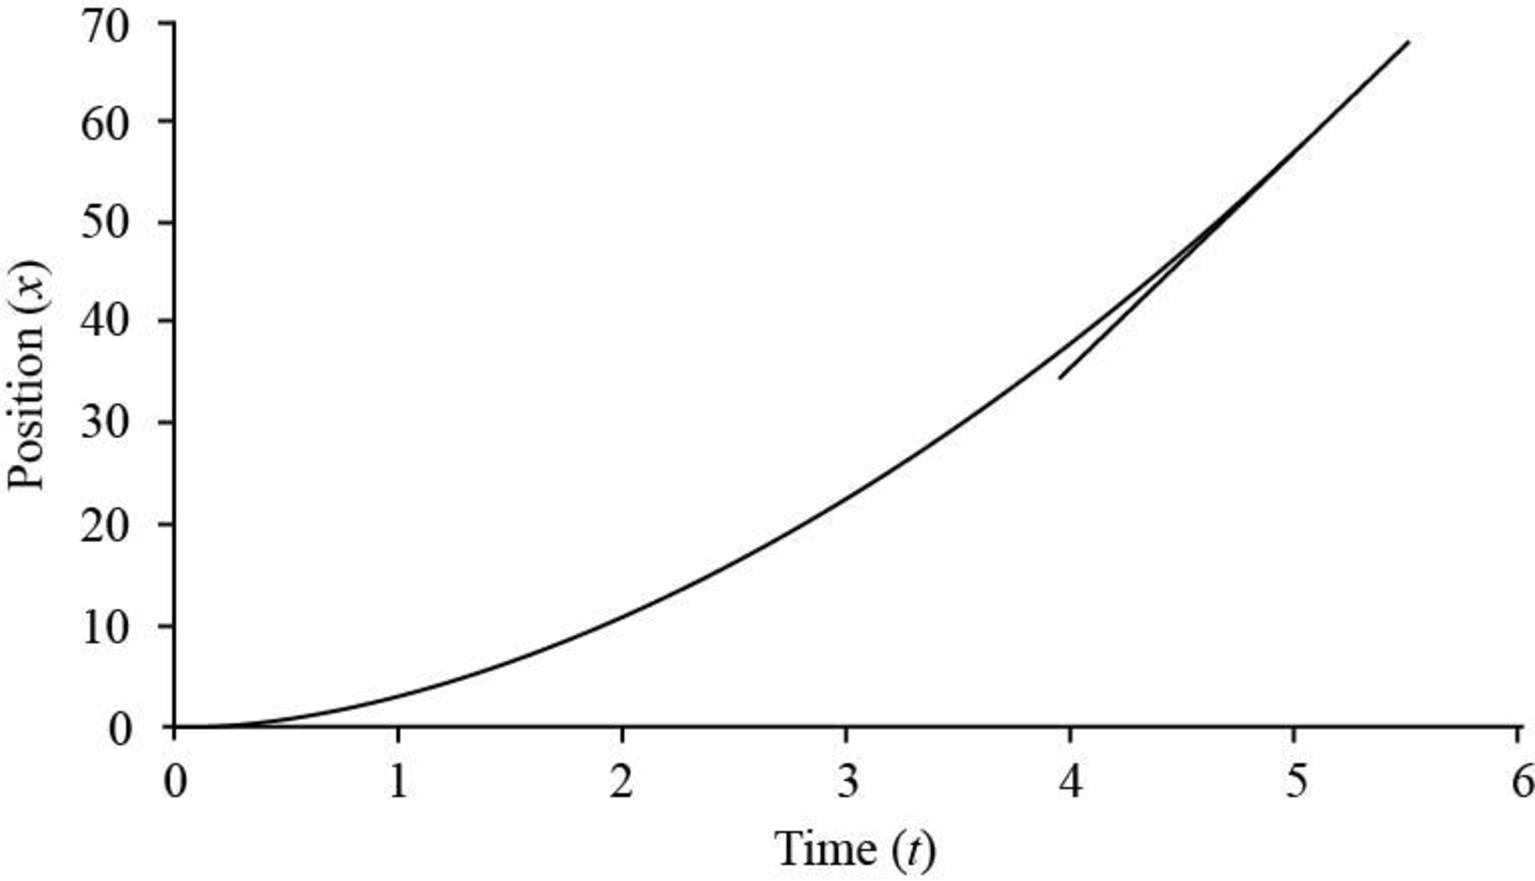
Figure VI
Substitute
Conclusion:
Therefore, the instantaneous velocity of the car at
(c)
The average acceleration of the car.
Answer to Problem 2.18P
The average acceleration of the car is
Explanation of Solution
The following table contains the instantaneous velocity of the car at various times instant.
The graph of instantaneous velocity versus time for the derby car is shown below.
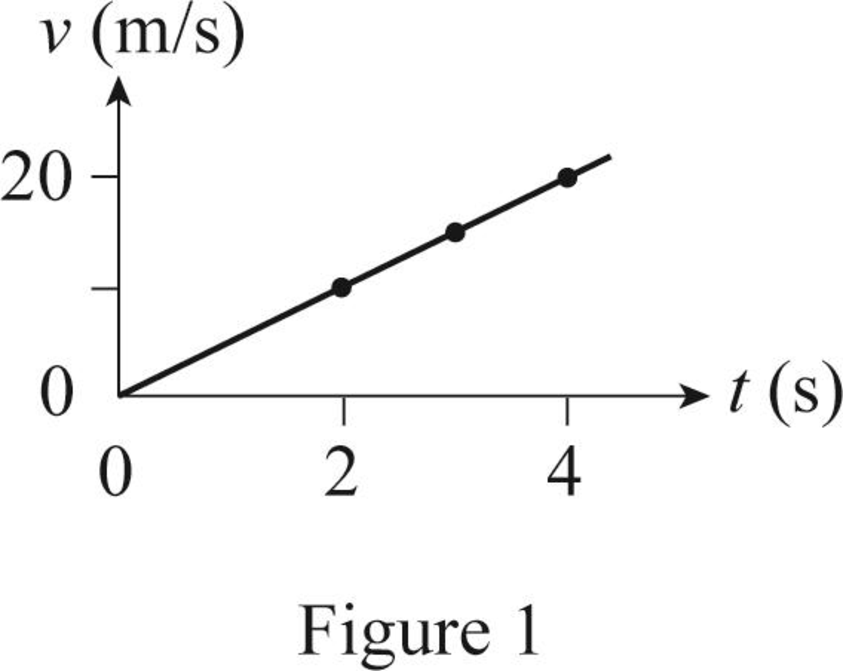
Figure VII
The figure VII shows that velocity of the car increases linearly, it means the acceleration of the car is constant throughout the motion.
Thus, the slope of this graph gives the average acceleration of the car.
Formula to calculate the slope of versus time graph is,
Here,
Substitute
From the graph, the slope of the graph is
Conclusion:
Therefore, the average acceleration of the car is
(d)
The initial velocity of the car.
Answer to Problem 2.18P
The initial velocity of the car is zero.
Explanation of Solution
The equation for the velocity of the car obtained from the graph is,
The first equation of motion gives the velocity of an object at any instant.
Here,
Compare equation (I) and (II).
Thus, the initial velocity of the car is zero.
Conclusion:
Therefore, the initial velocity of the car is zero.
Want to see more full solutions like this?
Chapter 2 Solutions
Physics for Scientists and Engineers, Technology Update, Hybrid Edition (with Enhanced WebAssign Multi-Term LOE Printed Access Card for Physics)
Additional Science Textbook Solutions
College Physics: A Strategic Approach (3rd Edition)
Cosmic Perspective Fundamentals
Essentials of Human Anatomy & Physiology (12th Edition)
Fundamentals of Anatomy & Physiology (11th Edition)


- pls help on thesearrow_forward20. Two small conducting spheres are placed on top of insulating pads. The 3.7 × 10⁻¹⁰ C sphere is fixed whie the 3.0 × 10⁷ C sphere, initially at rest, is free to move. The mass of each sphere is 0.09 kg. If the spheres are initially 0.10 m apart, how fast will the sphere be moving when they are 1.5 m apart?arrow_forwardpls help on allarrow_forward
- 19. Mount Everest, Earth's highest mountain above sea level, has a peak of 8849 m above sea level. Assume that sea level defines the height of Earth's surface. (re = 6.38 × 10⁶ m, ME = 5.98 × 1024 kg, G = 6.67 × 10 -11 Nm²/kg²) a. Calculate the strength of Earth's gravitational field at a point at the peak of Mount Everest. b. What is the ratio of the strength of Earth's gravitational field at a point 644416m below the surface of the Earth to a point at the top of Mount Everest? C. A tourist watching the sunrise on top of Mount Everest observes a satellite orbiting Earth at an altitude 3580 km above his position. Determine the speed of the satellite.arrow_forwardpls help on allarrow_forwardpls help on allarrow_forward
- 6. As the distance between two charges decreases, the magnitude of the electric potential energy of the two-charge system: a) Always increases b) Always decreases c) Increases if the charges have the same sign, decreases if they have the opposite signs d) Increases if the charges have the opposite sign, decreases if they have the same sign 7. To analyze the motion of an elastic collision between two charged particles we use conservation of & a) Energy, Velocity b) Momentum, Force c) Mass, Momentum d) Energy, Momentum e) Kinetic Energy, Potential Energyarrow_forwardpls help on all asked questions kindlyarrow_forwardpls help on all asked questions kindlyarrow_forward
 Principles of Physics: A Calculus-Based TextPhysicsISBN:9781133104261Author:Raymond A. Serway, John W. JewettPublisher:Cengage Learning
 University Physics Volume 1PhysicsISBN:9781938168277Author:William Moebs, Samuel J. Ling, Jeff SannyPublisher:OpenStax - Rice University
 Physics for Scientists and Engineers, Technology ...PhysicsISBN:9781305116399Author:Raymond A. Serway, John W. JewettPublisher:Cengage Learning
 Glencoe Physics: Principles and Problems, Student...PhysicsISBN:9780078807213Author:Paul W. ZitzewitzPublisher:Glencoe/McGraw-Hill
 College PhysicsPhysicsISBN:9781938168000Author:Paul Peter Urone, Roger HinrichsPublisher:OpenStax College
 College PhysicsPhysicsISBN:9781285737027Author:Raymond A. Serway, Chris VuillePublisher:Cengage Learning