Principles Of Geotechnical Engineering, Si Edition
9th Edition
ISBN: 9781305970953
Author: Braja M. Das, Khaled Sobhan
Publisher: Cengage Learning
expand_more
expand_more
format_list_bulleted
Concept explainers
Videos
Textbook Question
Chapter 2, Problem 2.10P
Repeat Problem 2.8 using the following data.
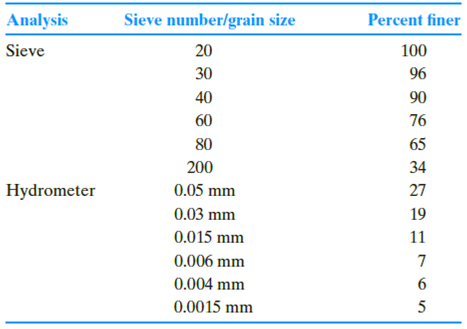
2.8 The following are the results of a sieve and hydrometer analysis.
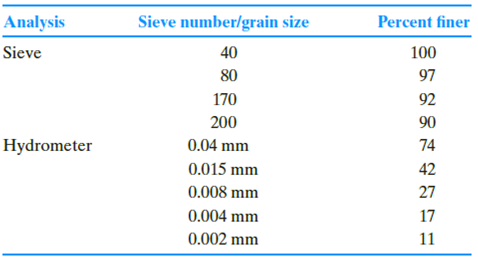
a. Draw the grain-size distribution curve.
b. Determine the percentages of gravel, sand, silt and clay according to the MIT system.
c. Repeat Part b according to the USDA system.
d. Repeat Part b according to the AASHTO system.
Expert Solution & Answer

Trending nowThis is a popular solution!

Students have asked these similar questions
1. A W10x60 with sections properties shown is to be used as a column. If the unsupported length is 5.0m, find the Safe Axial Load that can be carried by the section. Use Fy=248 MPa and K=1.50 (35pts)
Section Properties: A = 11355 mm2 Ix = 142x106 mm4 rx = 111.51 mm Iy = 48 x 106 mm4 ry = 65.28 mm
2. A Steel Column will be required to carry a total load of 500KN. If a tubular section will be utilized and the required dimension must not exceed 400x400, what will be the required thickness of the section (tf=tw). Use Fy=248 MPa L=4.5m, K=1.0 and 80% of initial fa will be used. (50pts) Note: Plate thickness available are: 2mm, 3mm, 4mm, 6mm, 8mm and 10mm
3. A steel tension rod will be subjected to a tension load of 320 KN. What will be the required diameter of the rod if Fy=248 MPa (15pts)
for purposes of orientation every contour may must display what?
During calibration of an LVDT, the data shown in the accompanying table were obtained. Using a spreadsheetprogram, plot the relation between the micrometer reading and voltage. What is the linear range of the LVDT? Determinethe calibration factor of the LVDT by obtaining the best fit line of the data within the linear range.
Chapter 2 Solutions
Principles Of Geotechnical Engineering, Si Edition
Ch. 2 - For a gravel with D60 = 0.48 mm, D30 = 0.25 mm,...Ch. 2 - Prob. 2.2PCh. 2 - Prob. 2.3PCh. 2 - The following are the results of a sieve analysis....Ch. 2 - Repeat Problem 2.4 with the following data. 2.4...Ch. 2 - Repeat Problem 2.4 with the following data. 2.4...Ch. 2 - Repeat Problem 2.4 with the following data. 2.4...Ch. 2 - The following are the results of a sieve and...Ch. 2 - Repeat Problem 2.8 using the following data. 2.8...Ch. 2 - Repeat Problem 2.8 using the following data. 2.8...
Ch. 2 - The grain-size characteristics of a soil are given...Ch. 2 - Repeat Problem 2.11 with the following data. 2.11...Ch. 2 - Repeat Problem 2.11 with the following data. 2.11...Ch. 2 - A hydrometer test has the following result: Gs =...Ch. 2 - Repeat Problem 2.14 with the following values: Gs...Ch. 2 - Three groups of students from the Geotechnical...Ch. 2 - Refer to Problem 2.C.1. Results of the sieve...
Knowledge Booster


Learn more about
Need a deep-dive on the concept behind this application? Look no further. Learn more about this topic, civil-engineering and related others by exploring similar questions and additional content below.Similar questions
- Develop a signal design and timing for the intersection shown in the figure below. In each case accommodate both vehicular and pedestrian movements. In general, use the following values for the problem: pedestrian walking speed = 1 [m/s], vehicle deceleration = 3 [m/s²], driver reaction time = 1.5 [s], length of vehicle = 6 [m], and level grade = 0. If you need to assume other variables and parameters to solve this problem clearly state that in your report and explain the reason. A250 1100 One-way Speed limit = 50 [km/h] Pedestrian = 15 per each crosswalk Crosswalk widths = 3 [m] Lane width = 4 [m] Saturation flow = 1800 [veh/h/lane] 1100 ↑ 200 70 80 900arrow_forwardhow land use and urban structure contribute to financial stability or instability.arrow_forwardQ1 parts B and C but plz draw it out or something plz put it on a bread board with resistors and a voltage source please do not show it in the schematic way like in the picture there if you can show it on like thinkercadarrow_forward
- Sketch the effective stress profile for the silt layer to a depth of 5 meters for a uniform layer of silt having a depth to the water table of 4 m (choose several discrete points with depth and plot by hand). Use Bishop's definition of effective stress for the silt layer, assuming x =S.. Assume a value of G. = 2.65 and that the gravimetric water content of the silt below the water table is 20%. Use the SWRC for the silt from the figure below. Assume that the air pressure is equal to atmospheric pressure (i.e., zero). Consider variations in total unit weight with the degree of saturation in your calculations. 100000 a. 10000 Sand: a = 0.3 kPa, n = 3.0 Silt: a=0.05 kPa, n=2.5 0.01 kPa, n = 1.8 1000 Clay: Matric suction (kPa) 00 100 10 10 1 0.1 ° 20 60 80 40 Saturation (%) 100 10arrow_forwardYou are asked to design a two-story commercial building that has reinforced masonry shear walls as shown below. The height of the parapet above the roof is 2 feet. The walls are to be constructed of 8-inch CMU and are to be fully grouted. The building is assigned to SDC D, and therefore, the walls have to be special RM shear walls according to TMS 402. There are 6 shear walls to resist the lateral seismic force along one principal axis of the building and 4 shear walls along the other axis. The corner walls are flanged walls meeting the requirements in Sec. 5.2.3 of TMS 402-22. The columns carry only gravity loads and no lateral seismic forces. The floor and roof diaphragms are relatively flexible in out-of-plane bending compared to the in-plane flexural stiffness of the walls, so that you can ignore the coupling moments and shear forces exerted by the diaphragms on the walls. However, the in-plane stiffness of the diagrams is high so that their planar deformation can be ignored.…arrow_forwardDevelop a signal design and timing for the intersection shown in the figure below. In each case accommodate both vehicular and pedestrian movements. In general, use the following values for the problem: pedestrian walking speed = 1 [m/s], vehicle deceleration = 3 [m/s²], driver reaction time = 1.5 [s], length of vehicle 6 [m], and level grade = 0. If you need to assume = other variables and parameters to solve this problem clearly state that in your report and explain the reason. 250 1100 One-way Speed limit = 50 [km/h] Pedestrian = 15 per each crosswalk Crosswalk widths = 3 [m] Lane width = 4 [m] Saturation flow = 1800 [veh/h/lane] 1100 70 80 T 200 900arrow_forward
- A pre-timed four-phase signal has critical lane group flow rates for the first three phases of 260, 280, and 310 [veh/h] (saturation flow rates are 2000 [veh/h/In] for all phases). The lost time is known to be 5 seconds for each phase. If the cycle length is 90 seconds, what is the estimated effective green time of the fourth phase?arrow_forwarda. Assume a bus line with N stops, where the distance between stops is S. Free flow speed of the bus is v, with acceleration and deceleration, a. P passengers per stop are boarding and alighting, and the time needed for a passenger to board or alight is T seconds. What is the average speed of a bus? b. Following on part (a), assume the origins of passengers are spread uniformly along the bus route. The destination of all passengers is the last stop. The walking speed of passengers is u. Determine the average travel time (walking + in-vehicle) of passengers. c. Simplify the above equation when N is large enough (approximating N-1/2 by N-1). Consider now that you can decide on S, where you replace N=L/S (L is the length of the route). Find the value of S that minimises the travelling time of the passengers. d. In the same setting as (c), assume that some passengers do not go to the terminal but alight before. Explain if your answer from (c) would increase or decrease and why. If you need…arrow_forwardThe minimum cycle length for an intersection is determined to be 95 seconds. The critical lane group flow ratios were calculated as 0.235, 0.25, 0.17, and 0.125, respectively. Assuming 5 seconds lost per phase, determine which X was used.arrow_forward
- A four-phase traffic signal has critical lane group flow ratios of 0.250, 0.150, 0.225 and 0.125. If the lost time per phase is 4 seconds and a critical intersection v/c of 0.85 is desired, calculate the minimum cycle length and the phase effective green times such that the lane group v/c ratios are equalized.arrow_forwardA pre-timed four-phase signal has critical lane group flow rates for the first three phases of 260, 280, and 310 [veh/h] (saturation flow rates are 2000 [veh/h/ln] for all phases). The lost time is known to be 5 seconds for each phase. If the cycle length is 90 seconds, what is the estimated effective green time of the fourth phase?arrow_forwardPLEASE SOLVE THE QUESTIONS IN THE PICTURE, make sure you show all of your work please. Thank you for your help!arrow_forward
arrow_back_ios
SEE MORE QUESTIONS
arrow_forward_ios
Recommended textbooks for you
 Principles of Geotechnical Engineering (MindTap C...Civil EngineeringISBN:9781305970939Author:Braja M. Das, Khaled SobhanPublisher:Cengage Learning
 Principles of Foundation Engineering (MindTap Cou...Civil EngineeringISBN:9781337705028Author:Braja M. Das, Nagaratnam SivakuganPublisher:Cengage Learning
 Fundamentals of Geotechnical Engineering (MindTap...Civil EngineeringISBN:9781305635180Author:Braja M. Das, Nagaratnam SivakuganPublisher:Cengage Learning
 Construction Materials, Methods and Techniques (M...Civil EngineeringISBN:9781305086272Author:William P. Spence, Eva KultermannPublisher:Cengage Learning
 Traffic and Highway EngineeringCivil EngineeringISBN:9781305156241Author:Garber, Nicholas J.Publisher:Cengage Learning
 Principles of Foundation Engineering (MindTap Cou...Civil EngineeringISBN:9781305081550Author:Braja M. DasPublisher:Cengage Learning
Principles of Geotechnical Engineering (MindTap C...
Civil Engineering
ISBN:9781305970939
Author:Braja M. Das, Khaled Sobhan
Publisher:Cengage Learning
Principles of Foundation Engineering (MindTap Cou...
Civil Engineering
ISBN:9781337705028
Author:Braja M. Das, Nagaratnam Sivakugan
Publisher:Cengage Learning
Fundamentals of Geotechnical Engineering (MindTap...
Civil Engineering
ISBN:9781305635180
Author:Braja M. Das, Nagaratnam Sivakugan
Publisher:Cengage Learning
Construction Materials, Methods and Techniques (M...
Civil Engineering
ISBN:9781305086272
Author:William P. Spence, Eva Kultermann
Publisher:Cengage Learning
Traffic and Highway Engineering
Civil Engineering
ISBN:9781305156241
Author:Garber, Nicholas J.
Publisher:Cengage Learning
Principles of Foundation Engineering (MindTap Cou...
Civil Engineering
ISBN:9781305081550
Author:Braja M. Das
Publisher:Cengage Learning
How Are Highways Designed?; Author: Practical Engineering;https://www.youtube.com/watch?v=9XIjqdk69O4;License: Standard Youtube License