
ELEM.STAT.-MYSTATLAB-ACCESS+EBOOK
13th Edition
ISBN: 9781323902653
Author: Triola
Publisher: PEARSON
expand_more
expand_more
format_list_bulleted
Videos
Textbook Question
Chapter 2, Problem 1RE
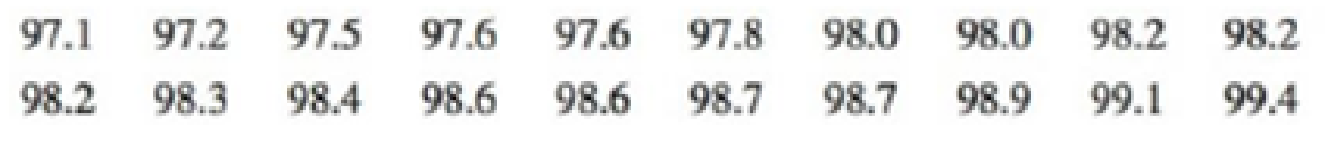
Frequency Distribution of Body Temperatures Construct a frequency distribution of the 20 body temperatures (°F) listed below. (These data are from Data Set 3 “Body Temperatures” in Appendix B.) Use a class width of 0.5°F and a starting value of 97.0°F.
Expert Solution & Answer
Want to see the full answer?
Check out a sample textbook solution
Students have asked these similar questions
Question 2: When John started his first job, his first end-of-year salary was $82,500. In the following years, he received salary raises as shown in the following table.
Fill the Table: Fill the following table showing his end-of-year salary for each year. I have already provided the end-of-year salaries for the first three years. Calculate the end-of-year salaries for the remaining years using Excel. (If you Excel answer for the top 3 cells is not the same as the one in the following table, your formula / approach is incorrect) (2 points)
Geometric Mean of Salary Raises: Calculate the geometric mean of the salary raises using the percentage figures provided in the second column named “% Raise”. (The geometric mean for this calculation should be nearly identical to the arithmetic mean. If your answer deviates significantly from the mean, it's likely incorrect. 2 points)
Starting salary
% Raise
Raise
Salary after raise
75000
10%
7500
82500
82500
4%
3300…
I need help with this problem and an explanation of the solution for the image described below. (Statistics: Engineering Probabilities)
I need help with this problem and an explanation of the solution for the image described below. (Statistics: Engineering Probabilities)
Chapter 2 Solutions
ELEM.STAT.-MYSTATLAB-ACCESS+EBOOK
Ch. 2.1 - McDonalds Dinner Service Times Refer 10 the...Ch. 2.1 - McDonalds Dinner Service Times Refer to the...Ch. 2.1 - Relative Frequency Distribution Use percentages to...Ch. 2.1 - Whats Wrong? Heights of adult males are known to...Ch. 2.1 - In Exercise 58, identify the class width, class...Ch. 2.1 - In Exercises 58, identify the class width, class...Ch. 2.1 - In Exercises 58, identify the class width, class...Ch. 2.1 - In Exercises 58, identify the class width, class...Ch. 2.1 - Normal Distributions. In Exercises 9 and 10, using...Ch. 2.1 - Normal Distributions. In Exercises 9 and 10, using...
Ch. 2.1 - Constructing Frequency Distributions. In Exercises...Ch. 2.1 - Constructing Frequency Distributions. In Exercises...Ch. 2.1 - Constructing Frequency Distributions. In Exercises...Ch. 2.1 - Burger King Dinner Service Times Refer to Data Set...Ch. 2.1 - Wendys Lunch Service Times Refer to Data Set 25...Ch. 2.1 - Wendys Dinner Service Times Refer to Data Set 25...Ch. 2.1 - Analysis of Last Digits Heights of statistics...Ch. 2.1 - Analysis of Last Digits Weights of respondents...Ch. 2.1 - Oscar Winners Construct one table (similar to...Ch. 2.1 - Blood Platelet Counts Construct one table (similar...Ch. 2.1 - Cumulative Frequency Distributions. In Exercises...Ch. 2.1 - Cumulative Frequency Distributions. In Exercises...Ch. 2.1 - Categorical Data. In Exercises 23 and 24, use the...Ch. 2.1 - Categorical Data. In Exercises 23 and 24, use the...Ch. 2.1 - Large Data Sets. Exercises 2528 involve large sets...Ch. 2.1 - Large Data Sets. Exercises 2528 involve large sets...Ch. 2.1 - Large Data Sets. Exercises 2528 involve large sets...Ch. 2.1 - Large Data Sets. Exercises 2528 involve large sets...Ch. 2.1 - Interpreting Effects of Outliers Refer to Data Set...Ch. 2.2 - Heights Heights of adult males are normally...Ch. 2.2 - More Heights The population of heights of adult...Ch. 2.2 - Blood Platelet Counts Listed below are blood...Ch. 2.2 - Blood Platelet Counts If we collect a sample of...Ch. 2.2 - Interpreting a Histogram. In Exercises 58, answer...Ch. 2.2 - Prob. 6BSCCh. 2.2 - Interpreting a Histogram. In Exercises 58, answer...Ch. 2.2 - Prob. 8BSCCh. 2.2 - Constructing Histograms. In Exercises 9-16,...Ch. 2.2 - Constructing Histograms. In Exercises 9-16,...Ch. 2.2 - Burger King Lunch Service Times Use the frequency...Ch. 2.2 - Burger King Dinner Service Times Use the frequency...Ch. 2.2 - Wendys Lunch Service Times Use the frequency...Ch. 2.2 - Wendys Dinner Service Times Use the frequency...Ch. 2.2 - Analysis of Last Digits Use the frequency...Ch. 2.2 - Analysis of Last Digits Use the frequency...Ch. 2.2 - Back-to-Back Relative Frequency Histograms When...Ch. 2.2 - Interpreting Normal Quantile Plots Which of the...Ch. 2.3 - Body Temperatures Listed below are body...Ch. 2.3 - Voluntary Response Data If we have a large...Ch. 2.3 - Ethics There are data showing that smoking is...Ch. 2.3 - CVDOT Section 2-1 introduced important...Ch. 2.3 - Dotplots. In Exercises 5 and 6, construct the...Ch. 2.3 - Diastolic Blood Pressure Listed below are...Ch. 2.3 - Stem plots. In Exercises 7 and 8, construct the...Ch. 2.3 - Stemplots. In Exercises 7 and 8, construct the...Ch. 2.3 - Time-Series Graphs. In Exercises 9 and 10,...Ch. 2.3 - Time-Series Graphs. In Exercises 9 and 10,...Ch. 2.3 - Pareto Charts. In Exercises 11 and 12 construct...Ch. 2.3 - Pareto Charts. In Exercises 11 and 12 construct...Ch. 2.3 - Pie Charts. In Exercises 13 and 14, construct the...Ch. 2.3 - Pie Charts. In Exercises 13 and 14, construct the...Ch. 2.3 - Frequency Polygon. In Exercises 15 and 16,...Ch. 2.3 - Frequency Polygon. In Exercises 15 and 16,...Ch. 2.3 - Self-Driving Vehicles In a survey of adults,...Ch. 2.3 - Deceptive Graphs. In Exercises 17-20, identify how...Ch. 2.3 - Deceptive Graphs. In Exercises 17-20, identify how...Ch. 2.3 - Deceptive Graphs. In Exercises 17-20, identify how...Ch. 2.3 - Expanded Stemplots A stemplot can be condensed by...Ch. 2.4 - Linear Correlation In this section we use r to...Ch. 2.4 - Causation A study has shown that there is a...Ch. 2.4 - Scanerplot What is a scatterplot and how does it...Ch. 2.4 - Estimating r For each of the following, estimate...Ch. 2.4 - Scatterplot. In Exercises 5-8, use the sample data...Ch. 2.4 - Scatterplot. In Exercises 5-8, use the sample data...Ch. 2.4 - Scatterplot. In Exercises 5-8, use the sample data...Ch. 2.4 - Scatterplot. In Exercises 5-8, use the sample data...Ch. 2.4 - Linear Correlation Coefficient In Exercises 9-12,...Ch. 2.4 - Linear Correlation Coefficient In Exercises 9-12,...Ch. 2.4 - Linear Correlation Coefficient In Exercises 9-12,...Ch. 2.4 - Using the data from Exercise 8 Heights of Fathers...Ch. 2.4 - Prob. 13BBCh. 2.4 - P-Values In Exercises 13-16, write a statement...Ch. 2.4 - P-Values In Exercises 13-16, write a statement...Ch. 2.4 - P-Values In Exercises 13-16, write a statement...Ch. 2 - Cookies Refer to the accompanying frequency...Ch. 2 - Cookies Using the same frequency distribution from...Ch. 2 - Cookies Using the same frequency distribution from...Ch. 2 - Cookies A stemplot of the same cookies summarized...Ch. 2 - Computers As a quality control manager at Texas...Ch. 2 - Distribution of Wealth In recent years, there has...Ch. 2 - Health Test In an investigation of a relationship...Ch. 2 - Lottery In Floridas Play 4 lottery game, four...Ch. 2 - Seatbelts The Beams Seatbelts company...Ch. 2 - Seatbelts A histogram is to be constructed from...Ch. 2 - Frequency Distribution of Body Temperatures...Ch. 2 - Histogram of Body Temperatures Construct the...Ch. 2 - Dotplot of Body Temperatures Construct a dotplot...Ch. 2 - Stemplot of Body Temperatures Construct a stemplot...Ch. 2 - Body Temperatures Listed below are the...Ch. 2 - Environment a. After collecting the average (mean)...Ch. 2 - Its Like Time Do This Exercise In a Marist survey...Ch. 2 - Whatever Use the same data from Exercise 7 to...Ch. 2 - In Exercises 1-6 refer to the data below, which...Ch. 2 - Frequency Distribution For the frequency...Ch. 2 - In Exercises 1-6, refer to the data below, which...Ch. 2 - In Exercises 1-6, refer to the data below, which...Ch. 2 - In Exercises 1-6, refer to the data below, which...Ch. 2 - Data Type a. The listed playing times are all...Ch. 2 - It was stated in this chapter that the days of...Ch. 2 - Fast Food Restaurant Drive-Through Service Times:...
Knowledge Booster


Learn more about
Need a deep-dive on the concept behind this application? Look no further. Learn more about this topic, statistics and related others by exploring similar questions and additional content below.Similar questions
- 310015 K Question 9, 5.2.28-T Part 1 of 4 HW Score: 85.96%, 49 of 57 points Points: 1 Save of 6 Based on a poll, among adults who regret getting tattoos, 28% say that they were too young when they got their tattoos. Assume that six adults who regret getting tattoos are randomly selected, and find the indicated probability. Complete parts (a) through (d) below. a. Find the probability that none of the selected adults say that they were too young to get tattoos. 0.0520 (Round to four decimal places as needed.) Clear all Final check Feb 7 12:47 US Oarrow_forwardhow could the bar graph have been organized differently to make it easier to compare opinion changes within political partiesarrow_forwardDraw a picture of a normal distribution with mean 70 and standard deviation 5.arrow_forward
- What do you guess are the standard deviations of the two distributions in the previous example problem?arrow_forwardPlease answer the questionsarrow_forward30. An individual who has automobile insurance from a certain company is randomly selected. Let Y be the num- ber of moving violations for which the individual was cited during the last 3 years. The pmf of Y isy | 1 2 4 8 16p(y) | .05 .10 .35 .40 .10 a.Compute E(Y).b. Suppose an individual with Y violations incurs a surcharge of $100Y^2. Calculate the expected amount of the surcharge.arrow_forward
- 24. An insurance company offers its policyholders a num- ber of different premium payment options. For a ran- domly selected policyholder, let X = the number of months between successive payments. The cdf of X is as follows: F(x)=0.00 : x < 10.30 : 1≤x<30.40 : 3≤ x < 40.45 : 4≤ x <60.60 : 6≤ x < 121.00 : 12≤ x a. What is the pmf of X?b. Using just the cdf, compute P(3≤ X ≤6) and P(4≤ X).arrow_forward59. At a certain gas station, 40% of the customers use regular gas (A1), 35% use plus gas (A2), and 25% use premium (A3). Of those customers using regular gas, only 30% fill their tanks (event B). Of those customers using plus, 60% fill their tanks, whereas of those using premium, 50% fill their tanks.a. What is the probability that the next customer will request plus gas and fill the tank (A2 B)?b. What is the probability that the next customer fills the tank?c. If the next customer fills the tank, what is the probability that regular gas is requested? Plus? Premium?arrow_forward38. Possible values of X, the number of components in a system submitted for repair that must be replaced, are 1, 2, 3, and 4 with corresponding probabilities .15, .35, .35, and .15, respectively. a. Calculate E(X) and then E(5 - X).b. Would the repair facility be better off charging a flat fee of $75 or else the amount $[150/(5 - X)]? [Note: It is not generally true that E(c/Y) = c/E(Y).]arrow_forward
- 74. The proportions of blood phenotypes in the U.S. popula- tion are as follows:A B AB O .40 .11 .04 .45 Assuming that the phenotypes of two randomly selected individuals are independent of one another, what is the probability that both phenotypes are O? What is the probability that the phenotypes of two randomly selected individuals match?arrow_forward53. A certain shop repairs both audio and video compo- nents. Let A denote the event that the next component brought in for repair is an audio component, and let B be the event that the next component is a compact disc player (so the event B is contained in A). Suppose that P(A) = .6 and P(B) = .05. What is P(BA)?arrow_forward26. A certain system can experience three different types of defects. Let A;(i = 1,2,3) denote the event that the sys- tem has a defect of type i. Suppose thatP(A1) = .12 P(A) = .07 P(A) = .05P(A, U A2) = .13P(A, U A3) = .14P(A2 U A3) = .10P(A, A2 A3) = .011Rshelfa. What is the probability that the system does not havea type 1 defect?b. What is the probability that the system has both type 1 and type 2 defects?c. What is the probability that the system has both type 1 and type 2 defects but not a type 3 defect? d. What is the probability that the system has at most two of these defects?arrow_forward
arrow_back_ios
SEE MORE QUESTIONS
arrow_forward_ios
Recommended textbooks for you
 Glencoe Algebra 1, Student Edition, 9780079039897...AlgebraISBN:9780079039897Author:CarterPublisher:McGraw Hill
 Holt Mcdougal Larson Pre-algebra: Student Edition...AlgebraISBN:9780547587776Author:HOLT MCDOUGALPublisher:HOLT MCDOUGAL
 Big Ideas Math A Bridge To Success Algebra 1: Stu...AlgebraISBN:9781680331141Author:HOUGHTON MIFFLIN HARCOURTPublisher:Houghton Mifflin Harcourt
 Trigonometry (MindTap Course List)TrigonometryISBN:9781337278461Author:Ron LarsonPublisher:Cengage Learning
 Trigonometry (MindTap Course List)TrigonometryISBN:9781305652224Author:Charles P. McKeague, Mark D. TurnerPublisher:Cengage Learning
Glencoe Algebra 1, Student Edition, 9780079039897...
Algebra
ISBN:9780079039897
Author:Carter
Publisher:McGraw Hill
Holt Mcdougal Larson Pre-algebra: Student Edition...
Algebra
ISBN:9780547587776
Author:HOLT MCDOUGAL
Publisher:HOLT MCDOUGAL
Big Ideas Math A Bridge To Success Algebra 1: Stu...
Algebra
ISBN:9781680331141
Author:HOUGHTON MIFFLIN HARCOURT
Publisher:Houghton Mifflin Harcourt
Trigonometry (MindTap Course List)
Trigonometry
ISBN:9781337278461
Author:Ron Larson
Publisher:Cengage Learning
Trigonometry (MindTap Course List)
Trigonometry
ISBN:9781305652224
Author:Charles P. McKeague, Mark D. Turner
Publisher:Cengage Learning
How to make Frequency Distribution Table / Tally Marks and Frequency Distribution Table; Author: Reenu Math;https://www.youtube.com/watch?v=i_A6RiE8tLE;License: Standard YouTube License, CC-BY
Frequency distribution table in statistics; Author: Math and Science;https://www.youtube.com/watch?v=T7KYO76DoOE;License: Standard YouTube License, CC-BY
Frequency Distribution Table for Grouped/Continuous data | Math Dot Com; Author: Maths dotcom;https://www.youtube.com/watch?v=ErnccbXQOPY;License: Standard Youtube License