Concept explainers
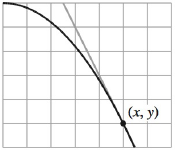
Approximating the Slope of a Graph In Exercises 1-4, approximate the slope of the graph at the point (x, y). (Each square on the grid is 1 unit by 1 unit.)

To calculate: The slope of the provided graph at the given point
The provided graph is shown below,

Answer to Problem 1RE
Solution:
The slope of the given curve at point
Explanation of Solution
Given Information:
The provided graph is shown below,

Each grid in the curve represents 1 unit by 1 unit as dimensions
Formula used:
Consider the equation of the given curve as
Here
Calculation:
The change in y is 4 units decreasing for 2 unit increase in x direction.
Hence, using formula for the slope of a function,
Here
The slope of the given graph is,
Now, as there is a decrease of 2 units in y as per increase in a unit of x
Therefore, the slope at point
Want to see more full solutions like this?
Chapter 2 Solutions
Calculus: An Applied Approach (MindTap Course List)
- Graph y=log2(x+3) 10+ 9 8 7- 6 5 4 3 3 2 1 10 -9 -8 -7 -6 -5 -4 -3-2-1 1 2 3 4 5 6 7 8 7 8 9 10 -1 -2 -3 -4 -5 -6 -7- -8 -9 -10 Clear All Drawarrow_forwardWrite an equation for the graph below. +10+ 9 10 -9 -8 -7 -6 -5 -4 -3-2-1 8 7 6 5 4 3 2 1 1 3 4 5 6 7 8 9 10 -1 -2 -3 -4 -5 -6 -7 -8 f(x) = 9 -9 -10-arrow_forward3. Solve the inequality and give your answer in interval notation. Be sure to show all your work, and write neatly so your work is easy to follow. (4 points) 2|3x+12 ≥ 18arrow_forward
- - 2. In words, interpret the inequality |x8|> 7 the same way I did in the videos. Note: the words "absolute value" should not appear in your answer! (2 points)arrow_forwardFind the tangential and normal components of the acceleration vector for the curve (t) = (2t, -3t5,-3+4) at the point t = 1 ā(1) = T + N Give your answers to two decimal placesarrow_forwardA gun is fired with muzzle velocity 1152 feet per second at a target 4150 feet away. Find the minimum angle of elevation necessary to hit the target. Assume the initial height of the bullet is 0 feet, neglect air resistance, and give your answer in degrees.arrow_forward
- "Use the Opposite Method to solve the following differential equation:" 4'"""" + 34" + 34 + 4 = xarrow_forwardFor the curve defined by (t) = (e cos(t), et sin(t)) find the unit tangent vector, unit normal vector, normal acceleration, and tangential acceleration at πT t = 3 П I(3) 丌_3_3 N (1) ат aN || = = =arrow_forwardFind the velocity vector for the position vector (t) = (sin(9+), 9t10, e¯7). x component = y component = Z component =arrow_forward
- In the xy-plane, an angle 0, in standard position, has a measure of the following is true? T. Which of 3 A The slope of the terminal ray of the angle is 1. B The slope of the terminal ray of the angle is 1. C D 3 The slope of the terminal ray of the angle is ✓ 2 The slope of the terminal ray of the angle is √3.arrow_forwardy'''-3y''+4y=e^2x Find particular solutionarrow_forward1 -1- Ο Graph of f y = + y = 1 + 1/2 ·2· x Graph of g y = 1- 플 The figure gives the graphs of the functions f and g in the xy-plane. The function of is given by f(x) = tan¹ x. Which of the following defines g(x)? A tan 1 x + 1 B - tan 1 x + П 2 C tan-1 (2/2) + 1 D tan-1 (2/2) + 1/1arrow_forward
- Algebra & Trigonometry with Analytic GeometryAlgebraISBN:9781133382119Author:SwokowskiPublisher:Cengage
 Big Ideas Math A Bridge To Success Algebra 1: Stu...AlgebraISBN:9781680331141Author:HOUGHTON MIFFLIN HARCOURTPublisher:Houghton Mifflin Harcourt
 Holt Mcdougal Larson Pre-algebra: Student Edition...AlgebraISBN:9780547587776Author:HOLT MCDOUGALPublisher:HOLT MCDOUGAL


