Macroeconomics
11th Edition
ISBN: 9781260506891
Author: Colander
Publisher: MCG
expand_more
expand_more
format_list_bulleted
Concept explainers
Question
Chapter 2, Problem 1QE
To determine
The shift of the
Expert Solution & Answer
Explanation of Solution
The figure shows the production possibility curve.
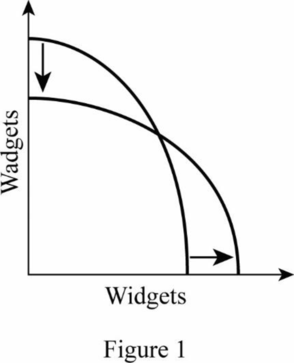
In the figure, the horizontal axis represents the production of widgets and the vertical axis represents production of wadgets. As a result of an increase in the production of widgets, the point that touches the X-axis will move rightward. If the production of wadgets decreases, the point that touches the Y-axis moves downward. This will create a new production possibility curve.
Economics Concept Introduction
Production possibility curve: Production possibility curve refers to the different combinations of two commodities that can be produced using the available resources and technologies fully and efficiently.
Want to see more full solutions like this?
Subscribe now to access step-by-step solutions to millions of textbook problems written by subject matter experts!
Students have asked these similar questions
Explain how the introduction of egg replacers and plant-based egg products will impact the bakery industry. Provide a graphical representation.
Explain Professor Frederick's "cognitive reflection" test.
11:44 Fri Apr 4
Would+You+Take+the+Bird+in+the+Hand
Would You Take the Bird in the Hand, or a 75% Chance at
the Two in the Bush?
BY VIRGINIA POSTREL
WOULD you rather have $1,000 for sure or a 90 percent chance
of $5,000? A guaranteed $1,000 or a 75 percent chance of
$4,000?
In economic theory, questions like these have no right or wrong
answers. Even if a gamble is mathematically more valuable a 75
percent chance of $4,000 has an expected value of $3,000, for
instance someone may still prefer a sure thing.
People have different tastes for risk, just as they have different
tastes for ice cream or paint colors. The same is true for waiting:
Would you rather have $400 now or $100 every year for 10
years? How about $3,400 this month or $3,800 next month?
Different people will answer differently.
Economists generally accept those differences without further
explanation, while decision researchers tend to focus on average
behavior.
In decision research, individual differences "are regarded…
Chapter 2 Solutions
Macroeconomics
Ch. 2.1 - Prob. 1QCh. 2.1 - Prob. 2QCh. 2.1 - Prob. 3QCh. 2.1 - Prob. 4QCh. 2.1 - Prob. 5QCh. 2.1 - Prob. 6QCh. 2.1 - Prob. 7QCh. 2.1 - Prob. 8QCh. 2.1 - Prob. 9QCh. 2.1 - Prob. 10Q
Ch. 2.A - Prob. 1QECh. 2.A - Prob. 2QECh. 2.A - Prob. 3QECh. 2.A - Prob. 4QECh. 2.A - Prob. 5QECh. 2.A - Prob. 6QECh. 2.A - Prob. 7QECh. 2.A - Prob. 8QECh. 2 - Prob. 1QECh. 2 - Prob. 2QECh. 2 - Prob. 3QECh. 2 - Prob. 4QECh. 2 - Prob. 5QECh. 2 - Prob. 6QECh. 2 - Prob. 7QECh. 2 - Prob. 8QECh. 2 - Prob. 9QECh. 2 - Prob. 10QECh. 2 - Prob. 11QECh. 2 - Prob. 12QECh. 2 - Prob. 1QAPCh. 2 - Prob. 2QAPCh. 2 - Prob. 3QAPCh. 2 - Prob. 4QAPCh. 2 - Prob. 5QAPCh. 2 - Prob. 1IPCh. 2 - Prob. 2IPCh. 2 - Prob. 3IPCh. 2 - Prob. 4IPCh. 2 - Prob. 5IPCh. 2 - Prob. 6IP
Knowledge Booster


Learn more about
Need a deep-dive on the concept behind this application? Look no further. Learn more about this topic, economics and related others by exploring similar questions and additional content below.Similar questions
- Describe the various measures used to assess poverty and economic inequality. Analyze the causes and consequences of poverty and inequality, and discuss potential policies and programs aimed at reducing them, assess the adequacy of current environmental regulations in addressing negative externalities. analyze the role of labor unions in labor markets. What is one benefit, and one challenge associated with labor unions.arrow_forwardEvaluate the effectiveness of supply and demand models in predicting labor market outcomes. Justify your assessment with specific examples from real-world labor markets.arrow_forwardExplain the difference between Microeconomics and Macroeconomics? 2.) Explain what fiscal policy is and then explain what Monetary Policy is? 3.) Why is opportunity cost and give one example from your own of opportunity cost. 4.) What are models and what model did we already discuss in class? 5.) What is meant by scarcity of resources?arrow_forward
- 2. What is the payoff from a long futures position where you are obligated to buy at the contract price? What is the payoff from a short futures position where you are obligated to sell at the contract price?? Draw the payoff diagram for each position. Payoff from Futures Contract F=$50.85 S1 Long $100 $95 $90 $85 $80 $75 $70 $65 $60 $55 $50.85 $50 $45 $40 $35 $30 $25 Shortarrow_forward3. Consider a call on the same underlier (Cisco). The strike is $50.85, which is the forward price. The owner of the call has the choice or option to buy at the strike. They get to see the market price S1 before they decide. We assume they are rational. What is the payoff from owning (also known as being long) the call? What is the payoff from selling (also known as being short) the call? Payoff from Call with Strike of k=$50.85 S1 Long $100 $95 $90 $85 $80 $75 $70 $65 $60 $55 $50.85 $50 $45 $40 $35 $30 $25 Shortarrow_forward4. Consider a put on the same underlier (Cisco). The strike is $50.85, which is the forward price. The owner of the call has the choice or option to buy at the strike. They get to see the market price S1 before they decide. We assume they are rational. What is the payoff from owning (also known as being long) the put? What is the payoff from selling (also known as being short) the put? Payoff from Put with Strike of k=$50.85 S1 Long $100 $95 $90 $85 $80 $75 $70 $65 $60 $55 $50.85 $50 $45 $40 $35 $30 $25 Shortarrow_forward
- The following table provides information on two technology companies, IBM and Cisco. Use the data to answer the following questions. Company IBM Cisco Systems Stock Price Dividend (trailing 12 months) $150.00 $50.00 $7.00 Dividend (next 12 months) $7.35 Dividend Growth 5.0% $2.00 $2.15 7.5% 1. You buy a futures contract instead of purchasing Cisco stock at $50. What is the one-year futures price, assuming the risk-free interest rate is 6%? Remember to adjust the futures price for the dividend of $2.15.arrow_forward5. Consider a one-year European-style call option on Cisco stock. The strike is $50.85, which is the forward price. The risk-free interest rate is 6%. Assume the stock price either doubles or halves each period. The price movement corresponds to u = 2 and d = ½ = 1/u. S1 = $100 Call payoff= SO = $50 S1 = $25 Call payoff= What is the call payoff for $1 = $100? What is the call payoff for S1 = $25?arrow_forwardMC The diagram shows a pharmaceutical firm's demand curve and marginal cost curve for a new heart medication for which the firm holds a 20-year patent on its production. Assume this pharmaceutical firm charges a single price for its drug. At its profit-maximizing level of output, it will generate a total profit represented by OA. areas J+K. B. areas F+I+H+G+J+K OC. areas E+F+I+H+G. D. - it is not possible to determine with the informatio OE. the sum of areas A through K. (...) Po P1 Price F P2 E H 0 G B Q MR D ōarrow_forward
- Price Quantity $26 0 The marketing department of $24 20,000 Johnny Rockabilly's record company $22 40,000 has determined that the demand for his $20 60,000 latest CD is given in the table at right. $18 80,000 $16 100,000 $14 120,000 The record company's costs consist of a $240,000 fixed cost of recording the CD, an $8 per CD variable cost of producing and distributing the CD, plus the cost of paying Johnny for his creative talent. The company is considering two plans for paying Johnny. Plan 1: Johnny receives a zero fixed recording fee and a $4 per CD royalty for each CD that is sold. Plan 2: Johnny receives a $400,000 fixed recording fee and zero royalty per CD sold. Under either plan, the record company will choose the price of Johnny's CD so as to maximize its (the record company's) profit. The record company's profit is the revenues minus costs, where the costs include the costs of production, distribution, and the payment made to Johnny. Johnny's payment will be be under plan 2 as…arrow_forwardWhich of the following is the best example of perfect price discrimination? A. Universities give entry scholarships to poorer students. B. Students pay lower prices at the local theatre. ○ C. A hotel charges for its rooms according to the number of days left before the check-in date. ○ D. People who collect the mail coupons get discounts at the local food store. ○ E. An airline offers a discount to students.arrow_forwardConsider the figure at the right. The profit of the single-price monopolist OA. is shown by area D+H+I+F+A. B. is shown by area A+I+F. OC. is shown by area D + H. ○ D. is zero. ○ E. cannot be calculated or shown with just the information given in the graph. (C) Price ($) B C D H FIG шо E MC ATC A MR D = AR Quantityarrow_forward
arrow_back_ios
SEE MORE QUESTIONS
arrow_forward_ios
Recommended textbooks for you


 Economics (MindTap Course List)EconomicsISBN:9781337617383Author:Roger A. ArnoldPublisher:Cengage Learning
Economics (MindTap Course List)
Economics
ISBN:9781337617383
Author:Roger A. Arnold
Publisher:Cengage Learning