
To explain the consequences of certain events on the US market for tobacco products.
Explanation of Solution
Certain events cause fluctuations in
Introduction:
a)
Shifts in demand due to a change in consumer expectations.
a)
Answer to Problem 1QAP
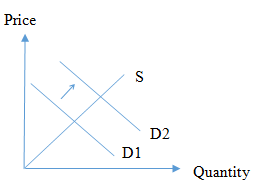
The demand curve will shift to the right which indicates an increase in demand due to the change in consumer expectations due to the food and drug administration classifying tobacco as an addictive drug.
Explanation of Solution
If there is a scenario where tobacco is classified as an addictive substance by a government authority such as the food and drug administration, it is likely that consumers of tobacco to view this signal and expect prices to increase steeply or expect tobacco products will be difficult to obtain in the future. Accordingly, the demand curve D1 will shift to D2.
Introduction:
b)
Shifts in supplyand increase in prices due to imposing an excise tax.
b)
Answer to Problem 1QAP
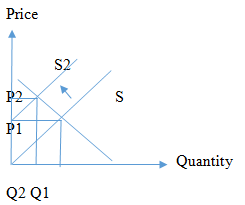
The supply curve will shift to the left which indicates an increased cost of providing tobacco to the market due to the excise tax.
Explanation of Solution
If there is a scenario where an excise tax is imposed, tobacco producers’ costs will increase, which will result in being unable to supply the product at the same

Introduction:
c)
Disruption in supplyand increase in prices due to natural events.
c)
Answer to Problem 1QAP
The supply curve will shift to the left which indicates a reduced supply of tobacco products due to Hurricane Fran.
Explanation of Solution
If there is a supply disruption to resources, caused due to hurricane Fran, tobacco producers’ supply will reduce until the supply disruption is rectified. This will result in being unable to supply the product to the market which will make tobacco products scarce in the market. This scarcity of tobacco products as well as resources creates a price hike. The S curve will shift to the left which is denoted by S2.
Introduction:
d)
The impact on tobacco products by producer expectations on future prices and availability.
d)
Answer to Problem 1QAP
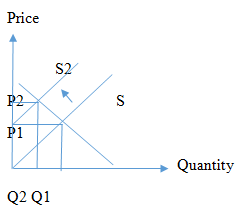
The supply curve will shift to the left which indicates a reduced supply of tobacco products due to supplier expectations on likely impositions on availability and prices.
Explanation of Solution
If there is a lawsuit by several states on tobacco producers the tobacco producers will limit supply due to price increases arising from litigation costs as well as taxes or reduced availability on tobacco products through regulations. This will result in tobacco producers reducing their supply to the market. Hence the S curve will shift to the left which is denoted by S2.
Introduction:
e)
Shifts in demand due tothe change of the perception on a complement or substitute good.
e)
Answer to Problem 1QAP
The demandcurve will shift to the right which indicates anincreased demand for tobacco products due to coffee being unappealing due to the risk of stomach cancer.
Explanation of Solution
In an event where research finds that a substitute for tobacco, in this case, coffee is harmful, the demand for tobacco products will rise due to consumer perception that coffee is no better than tobacco. This will result in coffee consumers switching to tobacco products and consumers who have limited their tobacco consumption and resorted to coffee switching back to tobacco creating increased demand. Hence the D1 curve will shift to the right which is denoted by D2.
Introduction:
Want to see more full solutions like this?
Chapter 2 Solutions
EBK HEALTH ECONOMICS AND POLICY

- Evaluate the effectiveness of supply and demand models in predicting labor market outcomes. Justify your assessment with specific examples from real-world labor markets.arrow_forwardExplain the difference between Microeconomics and Macroeconomics? 2.) Explain what fiscal policy is and then explain what Monetary Policy is? 3.) Why is opportunity cost and give one example from your own of opportunity cost. 4.) What are models and what model did we already discuss in class? 5.) What is meant by scarcity of resources?arrow_forward2. What is the payoff from a long futures position where you are obligated to buy at the contract price? What is the payoff from a short futures position where you are obligated to sell at the contract price?? Draw the payoff diagram for each position. Payoff from Futures Contract F=$50.85 S1 Long $100 $95 $90 $85 $80 $75 $70 $65 $60 $55 $50.85 $50 $45 $40 $35 $30 $25 Shortarrow_forward
- 3. Consider a call on the same underlier (Cisco). The strike is $50.85, which is the forward price. The owner of the call has the choice or option to buy at the strike. They get to see the market price S1 before they decide. We assume they are rational. What is the payoff from owning (also known as being long) the call? What is the payoff from selling (also known as being short) the call? Payoff from Call with Strike of k=$50.85 S1 Long $100 $95 $90 $85 $80 $75 $70 $65 $60 $55 $50.85 $50 $45 $40 $35 $30 $25 Shortarrow_forward4. Consider a put on the same underlier (Cisco). The strike is $50.85, which is the forward price. The owner of the call has the choice or option to buy at the strike. They get to see the market price S1 before they decide. We assume they are rational. What is the payoff from owning (also known as being long) the put? What is the payoff from selling (also known as being short) the put? Payoff from Put with Strike of k=$50.85 S1 Long $100 $95 $90 $85 $80 $75 $70 $65 $60 $55 $50.85 $50 $45 $40 $35 $30 $25 Shortarrow_forwardThe following table provides information on two technology companies, IBM and Cisco. Use the data to answer the following questions. Company IBM Cisco Systems Stock Price Dividend (trailing 12 months) $150.00 $50.00 $7.00 Dividend (next 12 months) $7.35 Dividend Growth 5.0% $2.00 $2.15 7.5% 1. You buy a futures contract instead of purchasing Cisco stock at $50. What is the one-year futures price, assuming the risk-free interest rate is 6%? Remember to adjust the futures price for the dividend of $2.15.arrow_forward
- 5. Consider a one-year European-style call option on Cisco stock. The strike is $50.85, which is the forward price. The risk-free interest rate is 6%. Assume the stock price either doubles or halves each period. The price movement corresponds to u = 2 and d = ½ = 1/u. S1 = $100 Call payoff= SO = $50 S1 = $25 Call payoff= What is the call payoff for $1 = $100? What is the call payoff for S1 = $25?arrow_forwardMC The diagram shows a pharmaceutical firm's demand curve and marginal cost curve for a new heart medication for which the firm holds a 20-year patent on its production. Assume this pharmaceutical firm charges a single price for its drug. At its profit-maximizing level of output, it will generate a total profit represented by OA. areas J+K. B. areas F+I+H+G+J+K OC. areas E+F+I+H+G. D. - it is not possible to determine with the informatio OE. the sum of areas A through K. (...) Po P1 Price F P2 E H 0 G B Q MR D ōarrow_forwardPrice Quantity $26 0 The marketing department of $24 20,000 Johnny Rockabilly's record company $22 40,000 has determined that the demand for his $20 60,000 latest CD is given in the table at right. $18 80,000 $16 100,000 $14 120,000 The record company's costs consist of a $240,000 fixed cost of recording the CD, an $8 per CD variable cost of producing and distributing the CD, plus the cost of paying Johnny for his creative talent. The company is considering two plans for paying Johnny. Plan 1: Johnny receives a zero fixed recording fee and a $4 per CD royalty for each CD that is sold. Plan 2: Johnny receives a $400,000 fixed recording fee and zero royalty per CD sold. Under either plan, the record company will choose the price of Johnny's CD so as to maximize its (the record company's) profit. The record company's profit is the revenues minus costs, where the costs include the costs of production, distribution, and the payment made to Johnny. Johnny's payment will be be under plan 2 as…arrow_forward
- Which of the following is the best example of perfect price discrimination? A. Universities give entry scholarships to poorer students. B. Students pay lower prices at the local theatre. ○ C. A hotel charges for its rooms according to the number of days left before the check-in date. ○ D. People who collect the mail coupons get discounts at the local food store. ○ E. An airline offers a discount to students.arrow_forwardConsider the figure at the right. The profit of the single-price monopolist OA. is shown by area D+H+I+F+A. B. is shown by area A+I+F. OC. is shown by area D + H. ○ D. is zero. ○ E. cannot be calculated or shown with just the information given in the graph. (C) Price ($) B C D H FIG шо E MC ATC A MR D = AR Quantityarrow_forwardConsider the figure. A perfectly price-discriminating monopolist will produce ○ A. 162 units and charge a price equal to $69. ○ B. 356 units and charge a price equal to $52 for the last unit sold only. OC. 162 units and charge a price equal to $52. OD. 356 units and charge a price equal to the perfectly competitive price. Dollars per Unit $69 $52 MR 162 356 Output MC Darrow_forward

 Economics (MindTap Course List)EconomicsISBN:9781337617383Author:Roger A. ArnoldPublisher:Cengage Learning


 Managerial Economics: A Problem Solving ApproachEconomicsISBN:9781337106665Author:Luke M. Froeb, Brian T. McCann, Michael R. Ward, Mike ShorPublisher:Cengage Learning