To explain the consequences of certain events on the US market for tobacco products.
Explanation of Solution
Certain events cause fluctuations in demand and supply curves. The events described involving the unfavorable perception of tobacco products, imposing taxes, lawsuits and supply disruptions in the tobacco industry and substitutes for tobacco products being unattractive.
Introduction:
a)
Shifts in demand due to a change in consumer expectations.
a)
Answer to Problem 1QAP
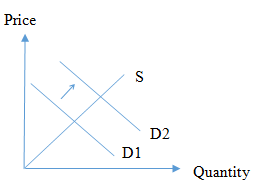
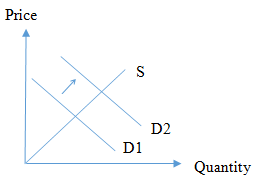
The demand curve will shift to the right which indicates an increase in demand due to the change in consumer expectations due to the food and drug administration classifying tobacco as an addictive drug.
Explanation of Solution
If there is a scenario where tobacco is classified as an addictive substance by a government authority such as the food and drug administration, it is likely that consumers of tobacco to view this signal and expect prices to increase steeply or expect tobacco products will be difficult to obtain in the future. Accordingly, the demand curve D1 will shift to D2.
Introduction:
b)
Shifts in supplyand increase in prices due to imposing an excise tax.
b)
Answer to Problem 1QAP
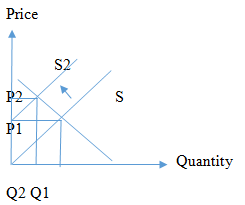
The supply curve will shift to the left which indicates an increased cost of providing tobacco to the market due to the excise tax.
Explanation of Solution
If there is a scenario where an excise tax is imposed, tobacco producers’ costs will increase, which will result in being unable to supply the product at the same price. Hence the S curve will shift to the left which is denoted by S+ tax. This shift results in an increased price, as well as a reduced quantity, demanded tobacco products.

Introduction:
c)
Disruption in supplyand increase in prices due to natural events.
c)
Answer to Problem 1QAP
The supply curve will shift to the left which indicates a reduced supply of tobacco products due to Hurricane Fran.
Explanation of Solution
If there is a supply disruption to resources, caused due to hurricane Fran, tobacco producers’ supply will reduce until the supply disruption is rectified. This will result in being unable to supply the product to the market which will make tobacco products scarce in the market. This scarcity of tobacco products as well as resources creates a price hike. The S curve will shift to the left which is denoted by S2.
Introduction:
d)
The impact on tobacco products by producer expectations on future prices and availability.
d)
Answer to Problem 1QAP
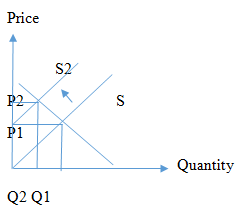
The supply curve will shift to the left which indicates a reduced supply of tobacco products due to supplier expectations on likely impositions on availability and prices.
Explanation of Solution
If there is a lawsuit by several states on tobacco producers the tobacco producers will limit supply due to price increases arising from litigation costs as well as taxes or reduced availability on tobacco products through regulations. This will result in tobacco producers reducing their supply to the market. Hence the S curve will shift to the left which is denoted by S2.
Introduction:
e)
Shifts in demand due tothe change of the perception on a complement or substitute good.
e)
Answer to Problem 1QAP
The demandcurve will shift to the right which indicates anincreased demand for tobacco products due to coffee being unappealing due to the risk of stomach cancer.
Explanation of Solution
In an event where research finds that a substitute for tobacco, in this case, coffee is harmful, the demand for tobacco products will rise due to consumer perception that coffee is no better than tobacco. This will result in coffee consumers switching to tobacco products and consumers who have limited their tobacco consumption and resorted to coffee switching back to tobacco creating increased demand. Hence the D1 curve will shift to the right which is denoted by D2.
Introduction:
Want to see more full solutions like this?
Chapter 2 Solutions
Health Economics and Policy

- 13:53 APP 簸洛瞭對照 Vo 56 5G 48% 48% atheva.cc/index/index/index.html The Most Trusted, Secure, Fast, Reliable Cryptocurrency Exchange Get started with the easiest and most secure platform to buy, sell, trade, and earn Cryptocurrency Balance:0.00 Recharge Withdraw Message About us BTC/USDT ETH/USDT EOS/USDT 83241.12 1841.50 83241.12 +1.00% +0.08% +1.00% Operating norms Symbol Latest price 24hFluctuation B BTC/USDT 83241.12 +1.00% ETH/USDT 1841.50 +0.08% B BTC/USD illı 83241.12 +1.00% Home Markets Trade Record Mine О <arrow_forwardThe production function of a firm is described by the following equation Q=10,000L-3L2 where Lstands for the units of labour.a) Draw a graph for this equation. Use the quantity produced in the y-axis, and the units of labour inthe x-axis. b) What is the maximum production level? c) How many units of labour are needed at that point?arrow_forwardDon't use ai to answer I will report you answerarrow_forward
- how to solve the attachment?arrow_forwardProblem 3-ABC Challenges: Attrition, Balance and ComplianceCan television inform people about public affairs? Political scientists Bethany Albertson and Adria Lawrence (2009) conducted an experiment in which they randomly assigned people to treatment and control groups to evaluate the effect of watching TV on a person’s information level. Those assigned to the treatment group were told to watch a specific television broadcast and were later asked questions related to what they watched. Those in the controlgroup were not shown the TV broadcast but were asked questions related to the material in the TV broadcast. The dataset contains the following variables: : Dummy variable which =1 if a person reads news and 0 otherwise. : interest in political affairs (not interested=1 to very interested=4) : years of education : female dummy variable (female=1; male=0) : family income in thousands of dollars : information level (low information level=1 to high information level=4) =1 if the…arrow_forwardProblem 2-Experiments/Randomized Control Trial Suppose you are interested in studying the effect of academic counselling on the years it takes for a student to obtain an undergraduate degree. You conduct a randomized control trial to answer the question. You randomly assign 2500 individuals in a university in New York to receive academic counselling and 2500 students to not receive any academic counselling. a. Which people are a part of the treatment group and which people are a part of thecontrol group? b. What regression will you run? Define the variables where required. c. Suppose you estimate = -0.3. Interpret it. d. You test for balance using the variables mentioned in the table below. Based on the results do you think that the treatment and control group are balanced? If your answer is “yes” then explain why. If your answer is “no”, then explain why and mention how will you address the issue of imbalance. e. Suppose that some unmotivated students in the control group decided to…arrow_forward
- How to calculate total cost?arrow_forwardProblem 1-Experiments/Randomized Control TrialSuppose you are interested in studying the effect of being a part of the labor union on anindividual’s hourly wage.You collect data on 1000 people and run the following regression. where is a dummy variable which is equal t to 1 for people who are a part of labor union and0 for others. a. Suppose you estimate . Interpret b. Do you think is biased or unbiased? Explain. Now suppose you conduct a randomized control trial to answer the same question. Yourandomly assign some individuals to be a part of the labor union and others to not be a partof the labor union. The first step you take is to ensure that the randomization was donecorrectly. Then you estimate the following equation: =1 if the student is assigned to be a part of Labor Union=0 if the student is assigned to not be a part of Labor Union c. Why is it important to ensure that the randomization is done correctly? d. Name any two variables that you can use to test if Treatment and…arrow_forwardWhat is kiosk?arrow_forward

 Economics (MindTap Course List)EconomicsISBN:9781337617383Author:Roger A. ArnoldPublisher:Cengage Learning


 Managerial Economics: A Problem Solving ApproachEconomicsISBN:9781337106665Author:Luke M. Froeb, Brian T. McCann, Michael R. Ward, Mike ShorPublisher:Cengage Learning