
Videos
For each of the determinants of
The impact of various factors on the demand, supply, and equilibrium price of hybrid gasoline-electric vehicles like Toyota Prius with the help of given supply and demand function.
Explanation of Solution
The demand curve is the graphical representation of quantity demanded by a consumer at a given price level. The changes in quantity demanded on the demand curve can be determined in two ways.
- Movement along the demand curve: this happens when the price of commodity change while keeping another factor constant. A rise in price leads to an upward movement along the demand curve whereas, when the price falls it leads to a downward movement along the demand curve.
- The shift in the demand curve: when factors other than price changes, demand curve shift either right or left
The demand function for Toyota prius can be expressed as:
Here, QD = quantity demanded of Toyota Prius,
P = price of Toyota prius,
PS = price of Nissan leaf, it is substitutes of Toyota prius,
PC = price of gasoline, which is complementary good for Toyota prius,
Y = income of consumers
A = advertising and promotion expenditures by Toyota
AC = competitors’ advertising and promotion expenditures
N = size of the potential target market
CP = consumer tastes and preferences for Toyota,
PE = expected future price appreciation or depreciation Toyota prius,
TA = purchase adjustment time period
T/S = taxes or subsidies on Toyota.
As demand for good increases (decreases), it will lead to increase (decrease) the equilibrium price of that good.
These are the factors that can impact the demand for Toyota prius (TP) in following manner:
| Factors | Result of change in factors | Equilibrium price: increase or decrease. |
| Increase (decrease) in price of Toyota prius | Decrease (increase) in quantity demanded for TP. | - |
| Increase (decrease) in price of Nissan leaf | Increase (decrease) in demand for TP. | Increase (decrease) in equilibrium price of TP. |
| Increase (decrease) in price of gasoline | Decrease (increase) in demand for TP. | Decrease (increase) in equilibrium price of TP. |
| Increase (decrease) in income of consumers | Increase (decrease) in demand for TP. | Increase (decrease) in equilibrium price of TP. |
| Increase (decrease) in advertising and promotion expenditures by Toyota | Increase (decrease) in demand for TP. | Increase (decrease) in equilibrium price of TP. |
| Increase (decrease) in competitors’ advertising and promotion expenditures | Decrease (increase) in demand for TP. | Decrease (increase) in equilibrium price of TP. |
| Increase (decrease) in size of the potential target market | Increase (decrease) in demand for TP. | Increase (decrease) in equilibrium price of TP. |
| Increase (decrease) in consumer tastes and preferences for Toyota | Increase (decrease) in demand for TP. | Increase (decrease) in equilibrium price of TP. |
| Increase (decrease) in expected future price appreciation or depreciation Toyota prius | Increase (decrease) in demand for TP. | Increase (decrease) in equilibrium price of TP. |
| Increase (decrease) in purchase adjustment time period | Increase (decrease) in demand for TP. | Increase (decrease) in equilibrium price of TP. |
| Increase (decrease) in taxes or subsidies on Toyota. | Decrease (increase) in demand for TP. Because of tax, price of TP rises and as a result demand will fall. | Decrease (increase) in equilibrium price of TP. |
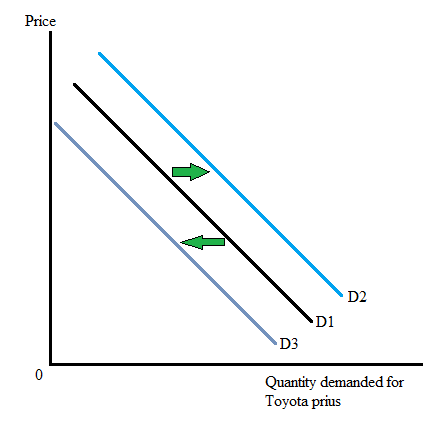
With the help of following graph, the increase and decrease in demand for TP can be seen. As demand for TP increases, the demand curve shifts to the right from D1 to D2. And as demand for TP fall, the demand curve shifts to the left from D1 to D3.
The supply curve is the graphical representation of quantity supplied by a producer at a given price level.
The supply function for Toyota prius (TP) can be expressed as:
Here, Qs = quantity supplied of TP
P = price of the TP
PI = price of inputs like sheet metal
PUI = price of unused substitute inputs like fiberglass
T = technological improvements
EE = entry or exit of other auto sellers
F = accidental supply interruptions from fires, floods, etc.
RC = costs of regulatory compliance
PE = expected (future) changes in price
TA = adjustment time period
T/S = taxes or subsidies
As supply of good increases (decreases), it will lead to decrease (increase) the equilibrium price of that good.
These are the factors that can impact the demand for Toyota prius (TP) in following manner:
| Factors | Result of change in factors | Equilibrium price: increase or decrease. |
| Increase (decrease) in price of Toyota prius | Increase (decrease) in quantity supplied for TP. | Decrease (increase) in equilibrium price of TP. |
| Increase (decrease) in price of inputs like sheet metal | Decrease (increase) in supply of TP. | Increase (decrease) in equilibrium price of TP. |
| Increase (decrease) in price of unused substitute inputs like fiberglass | Decrease (increase) in supply of TP. | Increase (decrease) in equilibrium price of TP. |
| Increase (decrease) in technological improvements | Increase (decrease) in supply of TP. | Decrease (increase) in equilibrium price of TP. |
| Increase (decrease) in entry or exit of other auto sellers | Increase (decrease) in supply of TP. | Decrease (increase) in equilibrium price of TP. |
| Increase (decrease) in accidental supply interruptions from fires, floods, etc. | Decrease (increase) in supply of TP. | Increase (decrease) in equilibrium price of TP. |
| Increase (decrease) in costs of regulatory compliance | Decrease (increase) in supply of TP. | Increase (decrease) in equilibrium price of TP. |
| Increase (decrease) in expected (future) changes in price | Decrease (increase) in supply of TP. | Increase (decrease) in equilibrium price of TP. |
| Increase (decrease) in adjustment time period | Increase (decrease) in supply of TP. | Decrease (increase) in equilibrium price of TP. |
| Increase (decrease) in taxes or subsidies on Toyota. | Decrease (increase) in supply of TP. | Increase (decrease) in equilibrium price of TP. |
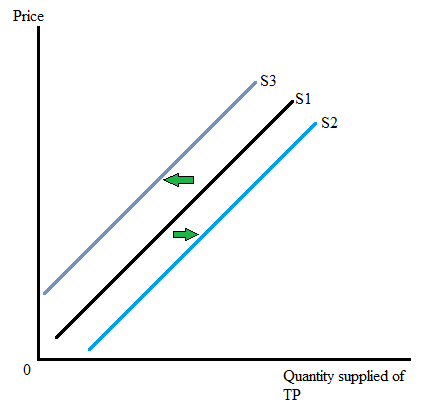
With the help of following graph, the increase and decrease in supply of TP can be seen. As supply of TP increases, the supply curve shifts to the right from S1 to S2. And as supply of TP fall, the supply curve shifts to the left from S1 to S3.
Want to see more full solutions like this?
Chapter 2 Solutions
Managerial Economics: Applications, Strategies and Tactics (MindTap Course List)


- Questions from textbook: Santerre, Rexford, E., and Neun, Stephan P. Health Economics: Theories, Insights, and Industry Studies, 6th Edition, ISBN 13: 978-1-111-822729. Mason, OH: South-Western, Cengage Learning, 2013. 1. Suppose a health expenditure function is specified in the following manner: E = 500 + 0.2Y where E represents annual health care expenditures per capita and Y stands for income per capita. a. Using the slope of the health expenditure function, predict the change in per capita health care expenditures that would result from a $1,000 increase in per capita income. b. Compute the level of per capita health care spending when per capita income takes on the following dollar values: 0; 1,000; 2,000; 4,000; and 6,000. c. Using the resulting values for per capita health care spending in part B, graph the associated health care expenditure function. d. Assume that the fixed amount of health care spending decreases to $250. Graph the new and original health care functions on…arrow_forwardGraph shows the daily market price of jeans when the tax on sellers is set to zero per pair supposed the government institutes attacks of $20.30 per pair to be paid by the seller what is the quantity after taxarrow_forwardHow do you figure out tax incidents in elasticityarrow_forward
 Managerial Economics: Applications, Strategies an...EconomicsISBN:9781305506381Author:James R. McGuigan, R. Charles Moyer, Frederick H.deB. HarrisPublisher:Cengage Learning
 Economics (MindTap Course List)EconomicsISBN:9781337617383Author:Roger A. ArnoldPublisher:Cengage Learning


