
Videos
For each of the determinants of
The impact of various factors on the demand, supply, and equilibrium price of hybrid gasoline-electric vehicles like Toyota Prius with the help of given supply and demand function.
Explanation of Solution
The demand curve is the graphical representation of quantity demanded by a consumer at a given price level. The changes in quantity demanded on the demand curve can be determined in two ways.
- Movement along the demand curve: this happens when the price of commodity change while keeping another factor constant. A rise in price leads to an upward movement along the demand curve whereas, when the price falls it leads to a downward movement along the demand curve.
- The shift in the demand curve: when factors other than price changes, demand curve shift either right or left
The demand function for Toyota prius can be expressed as:
Here, QD = quantity demanded of Toyota Prius,
P = price of Toyota prius,
PS = price of Nissan leaf, it is substitutes of Toyota prius,
PC = price of gasoline, which is complementary good for Toyota prius,
Y = income of consumers
A = advertising and promotion expenditures by Toyota
AC = competitors’ advertising and promotion expenditures
N = size of the potential target market
CP = consumer tastes and preferences for Toyota,
PE = expected future price appreciation or depreciation Toyota prius,
TA = purchase adjustment time period
T/S = taxes or subsidies on Toyota.
As demand for good increases (decreases), it will lead to increase (decrease) the equilibrium price of that good.
These are the factors that can impact the demand for Toyota prius (TP) in following manner:
| Factors | Result of change in factors | Equilibrium price: increase or decrease. |
| Increase (decrease) in price of Toyota prius | Decrease (increase) in quantity demanded for TP. | - |
| Increase (decrease) in price of Nissan leaf | Increase (decrease) in demand for TP. | Increase (decrease) in equilibrium price of TP. |
| Increase (decrease) in price of gasoline | Decrease (increase) in demand for TP. | Decrease (increase) in equilibrium price of TP. |
| Increase (decrease) in income of consumers | Increase (decrease) in demand for TP. | Increase (decrease) in equilibrium price of TP. |
| Increase (decrease) in advertising and promotion expenditures by Toyota | Increase (decrease) in demand for TP. | Increase (decrease) in equilibrium price of TP. |
| Increase (decrease) in competitors’ advertising and promotion expenditures | Decrease (increase) in demand for TP. | Decrease (increase) in equilibrium price of TP. |
| Increase (decrease) in size of the potential target market | Increase (decrease) in demand for TP. | Increase (decrease) in equilibrium price of TP. |
| Increase (decrease) in consumer tastes and preferences for Toyota | Increase (decrease) in demand for TP. | Increase (decrease) in equilibrium price of TP. |
| Increase (decrease) in expected future price appreciation or depreciation Toyota prius | Increase (decrease) in demand for TP. | Increase (decrease) in equilibrium price of TP. |
| Increase (decrease) in purchase adjustment time period | Increase (decrease) in demand for TP. | Increase (decrease) in equilibrium price of TP. |
| Increase (decrease) in taxes or subsidies on Toyota. | Decrease (increase) in demand for TP. Because of tax, price of TP rises and as a result demand will fall. | Decrease (increase) in equilibrium price of TP. |
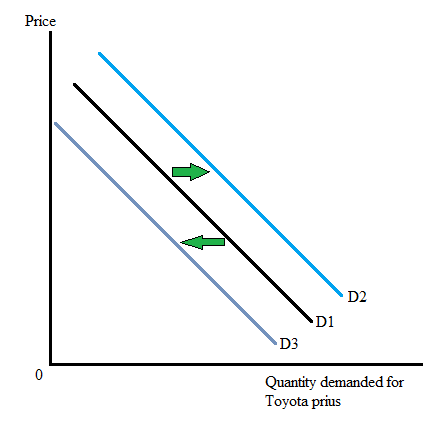
With the help of following graph, the increase and decrease in demand for TP can be seen. As demand for TP increases, the demand curve shifts to the right from D1 to D2. And as demand for TP fall, the demand curve shifts to the left from D1 to D3.
The supply curve is the graphical representation of quantity supplied by a producer at a given price level.
The supply function for Toyota prius (TP) can be expressed as:
Here, Qs = quantity supplied of TP
P = price of the TP
PI = price of inputs like sheet metal
PUI = price of unused substitute inputs like fiberglass
T = technological improvements
EE = entry or exit of other auto sellers
F = accidental supply interruptions from fires, floods, etc.
RC = costs of regulatory compliance
PE = expected (future) changes in price
TA = adjustment time period
T/S = taxes or subsidies
As supply of good increases (decreases), it will lead to decrease (increase) the equilibrium price of that good.
These are the factors that can impact the demand for Toyota prius (TP) in following manner:
| Factors | Result of change in factors | Equilibrium price: increase or decrease. |
| Increase (decrease) in price of Toyota prius | Increase (decrease) in quantity supplied for TP. | Decrease (increase) in equilibrium price of TP. |
| Increase (decrease) in price of inputs like sheet metal | Decrease (increase) in supply of TP. | Increase (decrease) in equilibrium price of TP. |
| Increase (decrease) in price of unused substitute inputs like fiberglass | Decrease (increase) in supply of TP. | Increase (decrease) in equilibrium price of TP. |
| Increase (decrease) in technological improvements | Increase (decrease) in supply of TP. | Decrease (increase) in equilibrium price of TP. |
| Increase (decrease) in entry or exit of other auto sellers | Increase (decrease) in supply of TP. | Decrease (increase) in equilibrium price of TP. |
| Increase (decrease) in accidental supply interruptions from fires, floods, etc. | Decrease (increase) in supply of TP. | Increase (decrease) in equilibrium price of TP. |
| Increase (decrease) in costs of regulatory compliance | Decrease (increase) in supply of TP. | Increase (decrease) in equilibrium price of TP. |
| Increase (decrease) in expected (future) changes in price | Decrease (increase) in supply of TP. | Increase (decrease) in equilibrium price of TP. |
| Increase (decrease) in adjustment time period | Increase (decrease) in supply of TP. | Decrease (increase) in equilibrium price of TP. |
| Increase (decrease) in taxes or subsidies on Toyota. | Decrease (increase) in supply of TP. | Increase (decrease) in equilibrium price of TP. |
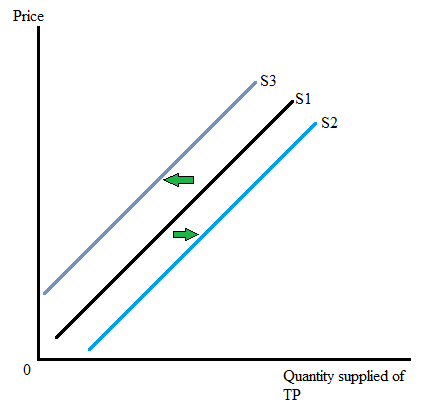
With the help of following graph, the increase and decrease in supply of TP can be seen. As supply of TP increases, the supply curve shifts to the right from S1 to S2. And as supply of TP fall, the supply curve shifts to the left from S1 to S3.
Want to see more full solutions like this?
Chapter 2 Solutions
Managerial Economics: Applications, Strategies and Tactics (MindTap Course List)


- 2. Case 1) NG price decreases Now, suppose that the price of natural gas decreased substantially, causing the marginal cost of the NG power plant to decrease to MC = $35/MWh. The demand is the same as in Case 0. (a) Draw a new supply curve that reflects the MC change of the NG power plant. (b) Find the market clearing prices and calculate how much electricity each power plant generates in the hourly market (4AM, 10AM, 2PM, and 6PM). (c) What happened to the coal power plant? (d) Do you think the market outcomes (like average price) and the total CO2 emissions have improved under this Case 1 scenario (use the emissions data provided in the lecture slides)?arrow_forward1. Case 0) Baseline case Table 1: Power Plant Capacity and Marginal Cost: Case 0 Plant # Energy Source Capacity (MW) MC (S/MWh) 1 Coal 300 45 2 Oil 100 90 3 4 Natural Gas Nuclear 500 50 600 0 (a) Calculate the capacity mix of this market by energy source. (b) Draw a supply curve of this wholesale generation market. Table 2 below shows the demand levels for selected hours of a representative day. We will consider only these four hourly markets for our analysis. Note that the 6 PM demand is the highest demand level of the day. Table 2: Hourly Demand (selected hours) Hour Demand (MWh) 4 AM 500 10 AM 700 2 PM 800 6 PM 1000 (c) Find the market clearing prices and calculate how much electricity each power plant generates in the hourly market (4AM, 10AM, 2PM, and 6PM). (d) Find the average price of electricity (by taking a simple average of hourly prices; [P(4am) + P(10AM) + P(2PM) + P(6PM)]/4).arrow_forwardDon't used Ai solutionarrow_forward
- How human recource allocated in an economic?arrow_forwardRespond to B.A. I have chosen Gross Domestic Product (GDP) as the macroeconomic indicator to review and provide a forecast prediction. Based on the current trend I predict a 2% annual GDP growth rate, indicating an unstable economy due to the impact of Donald Trump's tariffs on some countries and other other economic factors. This growth rate is lower than the historical average , indicating a slowdown in economic expansion. Overall, the forecast suggests a modest growth in GDP, but with potential risks and uncertainties ahead. But if he reverse his tariff policies, I think it could possibly result in a strong economic growth. As the removal of tariffs would likely minimize the costs for businesses and consumers and also rise trade and economic activities. Provide feedback/comments this post. You could agreement or disagreement (including why you agree or disagree). Or you could expand on this post by sharing different views and predictions.arrow_forwardCan you show me how to solve this.arrow_forward
- ECON 2106: Microeconomics I Fall - 2023 Algoma University Homework # 2 (Due: October 19, 2023) 1. The market demand for cashmere socks is given by Q = 1,000 + 0.5I – 400P + 200P’ Where, Q = Annual demand in number of pairs I = Average income I dollars per year P = Price of one pair of cashmere shocks P’ = Price of one pair of wool shocks Given that I = ECON 2106: Microeconomics I Fall - 2023 Algoma University Homework # 2 (Due: October 19, 2023) 1. The market demand for cashmere socks is given by Q = 1,000 + 0.5I – 400P + 200P’ Where, Q = Annual demand in number of pairs I = Average income I dollars per year P = Price of one pair of cashmere shocks P’ = Price of one pair of wool shocks Given that I = $20,000, P = $10, and P’ = $5, determine ƐQP, ƐQI, and ƐQP’.arrow_forwardWhat bill are they currently sponsoring? Please provide the answer to the question using www.akleg.gov for Senate Bill 30?arrow_forwardDo they have any specified areas of interest( examples: oil/gas, education, subsistence). Please provide the answer to the question using www.akleg.gov for Senate Bill 30?arrow_forward
- A brief synopsis of whether you believe they represent your interest, why or why not? Please provide the answer to this question by using www.akleg for senate bill 30 ?arrow_forwardWhat is their background (degree, career/job, community of origin, anything else you choose to include) Please provide the answers using www.akleg.gov for Senate Bill 30?arrow_forwardPlease provide the answer to these questions using informatioin from www.akleg.gov for Senate bill 30. What is their party affiliation?arrow_forward
 Managerial Economics: Applications, Strategies an...EconomicsISBN:9781305506381Author:James R. McGuigan, R. Charles Moyer, Frederick H.deB. HarrisPublisher:Cengage Learning
 Economics (MindTap Course List)EconomicsISBN:9781337617383Author:Roger A. ArnoldPublisher:Cengage Learning


