Student Solutions Manual for Brase/Brase's Understanding Basic Statistics, 7th
7th Edition
ISBN: 9781305258792
Author: BRASE, Charles Henry
Publisher: Cengage Learning
bartleby

Concept explainers

bartleby

Videos

Textbook Question
Book Icon
Chapter 2, Problem 1DHGP

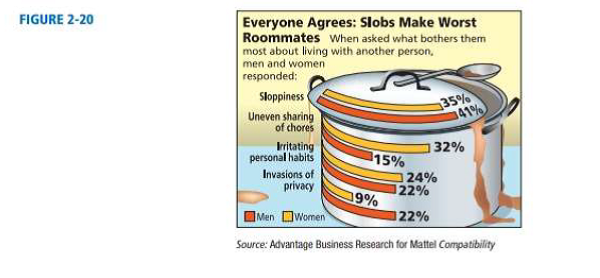
Examine Figure 2-20, “Everyone Agrees: Slobs Make Worst Roommates.” This is a clustered bar graph because two percentages are given for each response category; responses from men and responses from women. Comment about how the artistic rendition has slightly changed the format of a bar graph. Do the bars seem to have lengths that accurately reflect the relative percentages of the responses? In your own opinion, does the artistic rendition enhance or confuse the information? Explain. Which characteristic of “worst roommates” does the graphic seem to illustrate? Can this graph be considered a Pareto chart for men? For women? Why or why not? From the information given in the figure, do you think the survey just listed the four given annoying characteristics? Do you think a respondent could choose more than one characteristic? Explain your answer in terms of the percentages given and in terms of the explanation given in the graphic. Could this information also be displayed in one circle graph for men and another for women? Explain.

Chapter 2, Problem 1DHGP, Examine Figure 2-20, Everyone Agrees: Slobs Make Worst Roommates. This is a clustered bar graph

Blurred answer
Students have asked these similar questions
NC Current Students - North Ce X | NC Canvas Login Links - North ( X Final Exam Comprehensive x Cengage Learning x WASTAT - Final Exam - STAT → C webassign.net/web/Student/Assignment-Responses/submit?dep=36055360&tags=autosave#question3659890_9 Part (b) Draw a scatter plot of the ordered pairs. N Life Expectancy Life Expectancy 80 70 600 50 40 30 20 10 Year of 1950 1970 1990 2010 Birth O Life Expectancy Part (c) 800 70 60 50 40 30 20 10 1950 1970 1990 W ALT 林 $ # 4 R J7 Year of 2010 Birth F6 4+ 80 70 60 50 40 30 20 10 Year of 1950 1970 1990 2010 Birth Life Expectancy Ox 800 70 60 50 40 30 20 10 Year of 1950 1970 1990 2010 Birth hp P.B. KA & 7 80 % 5 H A B F10 711 N M K 744 PRT SC ALT CTRL
Harvard University California Institute of Technology Massachusetts Institute of Technology Stanford University Princeton University University of Cambridge University of Oxford University of California, Berkeley Imperial College London Yale University University of California, Los Angeles University of Chicago Johns Hopkins University Cornell University ETH Zurich University of Michigan University of Toronto Columbia University University of Pennsylvania Carnegie Mellon University University of Hong Kong University College London University of Washington Duke University Northwestern University University of Tokyo Georgia Institute of Technology Pohang University of Science and Technology University of California, Santa Barbara University of British Columbia University of North Carolina at Chapel Hill University of California, San Diego University of Illinois at Urbana-Champaign National University of Singapore McGill…
Name Harvard University California Institute of Technology Massachusetts Institute of Technology Stanford University Princeton University University of Cambridge University of Oxford University of California, Berkeley Imperial College London Yale University University of California, Los Angeles University of Chicago Johns Hopkins University Cornell University ETH Zurich University of Michigan University of Toronto Columbia University University of Pennsylvania Carnegie Mellon University University of Hong Kong University College London University of Washington Duke University Northwestern University University of Tokyo Georgia Institute of Technology Pohang University of Science and Technology University of California, Santa Barbara University of British Columbia University of North Carolina at Chapel Hill University of California, San Diego University of Illinois at Urbana-Champaign National University of Singapore…

Chapter 2 Solutions

Student Solutions Manual for Brase/Brase's Understanding Basic Statistics, 7th

Ch. 2.1 - Interpretation Histograms of random sample data...Ch. 2.1 - Interpretation The following histograms are based...Ch. 2.1 - Interpretation The ogives shown are based on U.S...Ch. 2.1 - Critical Thinking The following ogives come from...Ch. 2.1 - For Problems 15-20. use the specified number of...Ch. 2.1 - For Problems 15-20, use the specified number of...Ch. 2.1 - For Problems 15-20, use the specified number of...Ch. 2.1 - For Problems 15-20, use the specified number of...Ch. 2.1 - Prob. 19PCh. 2.1 - Prob. 20PCh. 2.1 - Expand Your knowledge: Decimal Data The fallowing...Ch. 2.1 - Decimal Data: Batting Averages The following data...Ch. 2.1 - Expand Your Knowledge: Dotplot another display...Ch. 2.1 - 24. Dotplot: Sled Dog Racing Make a dotplot for...Ch. 2.1 - Prob. 25PCh. 2.2 - 1. Interpretation Consider graph (a) of Reasons...Ch. 2.2 - Interpretation Look at graph (b) of Reasons People...Ch. 2.2 - Critical Thinking A personnel office is gathering...Ch. 2.2 - Critical Thinking Your friend is thinking about...Ch. 2.2 - Prob. 5PCh. 2.2 - Interpretation Consider the two graphs depicting...Ch. 2.2 - Commercial Fishing: Gulf of Alaska It's not an...Ch. 2.2 - Archaeology: Ireland Commercial dredging...Ch. 2.2 - Lifestyle: Hide the Mess! A survey of 1000 adults...Ch. 2.2 - Education: College Professors' Time How do college...Ch. 2.2 - FBI Report: Hawaii In the Aloha state, you are...Ch. 2.2 - Driving: Bad Habits Driving would be more pleasant...Ch. 2.2 - Prob. 13PCh. 2.2 - Vital Statistics: Height How dies average height...Ch. 2.2 - Expand Your Knowledge Donut Pie Charts The book...Ch. 2.2 - Technology: Cars The following cluster bar graph...Ch. 2.3 - Cowboys: Longevity How long did real cowboys live?...Ch. 2.3 - Ecology: Habitat Wetlands offer a diversity of...Ch. 2.3 - Prob. 3PCh. 2.3 - Health Care: Hospitals Using the number of...Ch. 2.3 - Prob. 5PCh. 2.3 - Prob. 6PCh. 2.3 - Are cigarettes bad for people? Cigarette smoking...Ch. 2.3 - Are cigarettes bad for people? Cigarette smoking...Ch. 2.3 - Are cigarettes bad for people? Cigarette smoking...Ch. 2.3 - Expand Your Knowledge: Back-to-Back Stem Plot In...Ch. 2 - Critical Thinking Consider these types of graphs:...Ch. 2 - Critical Thinking A consumer interest group is...Ch. 2 - Critical Thinking Describe how data outliers might...Ch. 2 - Expand Your Knowledge How are dotplots and...Ch. 2 - Focus Problem: Fuel Economy Solve the focus...Ch. 2 - Criminal Justice: Prisoners The time plot in...Ch. 2 - IRS: Tax Returns Almost everyone files (or will...Ch. 2 - Prob. 8CRCh. 2 - Prob. 9CRCh. 2 - Law: Corporation Lawsuits Many people say the...Ch. 2 - Archaeology: Tree-King DataThe Sand Canyon...Ch. 2 - Interpretation A Harm Poll surveyed 2085 U.S....Ch. 2 - Examine Figure 2-20, Everyone Agrees: Slobs Make...Ch. 2 - Examine Figure 2-21, Global Teen Worries. How many...Ch. 2 - In your own words, explain the differences among...Ch. 2 - What do we mean when we say a histogram is skewed...Ch. 2 - Discuss the statement that stem-and-leaf displays...Ch. 2 - The following tables show the first-round winning...Ch. 2 - The following tables show the first-round winning...Ch. 2 - The Following tables show the first-round winning...
Knowledge Booster
Background pattern image
Statistics
Learn more about
Need a deep-dive on the concept behind this application? Look no further. Learn more about this topic, statistics and related others by exploring similar questions and additional content below.
Similar questions
SEE MORE QUESTIONS
Recommended textbooks for you
Text book image
Glencoe Algebra 1, Student Edition, 9780079039897...
Algebra
ISBN:9780079039897
Author:Carter
Publisher:McGraw Hill
Text book image
Holt Mcdougal Larson Pre-algebra: Student Edition...
Algebra
ISBN:9780547587776
Author:HOLT MCDOUGAL
Publisher:HOLT MCDOUGAL
Text book image
Big Ideas Math A Bridge To Success Algebra 1: Stu...
Algebra
ISBN:9781680331141
Author:HOUGHTON MIFFLIN HARCOURT
Publisher:Houghton Mifflin Harcourt
Text book image
Functions and Change: A Modeling Approach to Coll...
Algebra
ISBN:9781337111348
Author:Bruce Crauder, Benny Evans, Alan Noell
Publisher:Cengage Learning
Points, Lines, Planes, Segments, & Rays - Collinear vs Coplanar Points - Geometry; Author: The Organic Chemistry Tutor;https://www.youtube.com/watch?v=dDWjhRfBsKM;License: Standard YouTube License, CC-BY
Naming Points, Lines, and Planes; Author: Florida PASS Program;https://www.youtube.com/watch?v=F-LxiLSSaLg;License: Standard YouTube License, CC-BY