
Videos
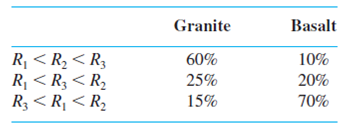
One method used to distinguish between granitic (G) and basaltic (B) rocks is to examine a portion of the infrared spectrum of the sun’s energy reflected from the rock surface. Let R1, R2, and R3 denote measured spectrum intensities at three different wavelengths; typically, for granite R1 < R2 < R3, whereas for basalt R3 < R1 < R2. When measurements are made remotely (using aircraft), various orderings of the Ris may arise whether the rock is basalt or granite. Flights over regions of known composition have yielded the following information:
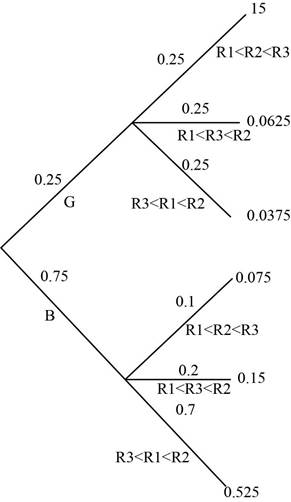
Suppose that for a randomly selected rock in a certain region, P(granite) 5 .25 and P(basalt) 5 .75.
- a. Show that P(granite | R1 < R2 < R3) > P(basalt | R1 < R2 < R3). If measurements yielded R1 < R2 < R3, would you classify the rock as granite or basalt?
- b. If measurements yielded R1 < R3 < R2, how would you classify the rock? Answer the same question for R3 < R1 < R2.
- c. Using the classification rules indicated in parts (a) and (b), when selecting a rock from this region, what is the
probability of an erroneous classification? [Hint: Either G could be classified as B or B as G, and P(B) and P(G) are known.] - d. If P(granite) = p rather than .25, are there values of p (other than 1) for which one would always classify a rock as granite?
a.
Show that
Explain whether the granite or basalt is classified as rock.
Answer to Problem 106SE
It has been verified that
The rock is classified as granite.
Explanation of Solution
Given info:
The information is based on the method that helps to differentiate between the granite and basaltic rocks to examine between the infrared spectrums of the sun’s energy from the rock surface. The events
The composition of the salts is obtained in the table given below:
| Granite | Basalt | |
| 60% | 10% | |
| 25% | 20% | |
| 15% | 70% |
Calculation:
Bayles’ rule:
If
Here,
Law of total probability:
Assume that the eventsA1, A2, A3,…,Ak be mutually exclusive and exhaustive events.
For any event B,
The probability of B is obtained as:
Define the events:
The probability of the corresponding event is given below:
The probability of the granite and
The probability of the granite and
The probability of the granite and
The probability of the basalt and
The probability of the basalt and
The probability of the basalt and
Here, the probabilities of the events are represented using tree diagram given below:
By using law of total probability, the probability of the
Thus, the probability of
The probability of
Thus the
The probability of
Thus the
Hence, the probability of
b.
Explain whether the rock is classified as granite or basalt.
Answer to Problem 106SE
For both
Explanation of Solution
Calculation:
By using law of total probability, the probability of the
Thus, the probability of
The probability of
Here, the probability is less than 0.5. It is classified as basalt.
The probability of
Here, the probability is less than 0.5. It is classified as basalt.
c.
Obtain the probability of an erroneous classification.
Answer to Problem 106SE
The probability of an erroneous classification is 0.175.
Explanation of Solution
Here, G denotes granite and B denotes basalt.
The probability of the erroneous classification is obtained as shown below:
Thus, the probability of the erroneous classification is 0.1625.
d.
Identify for which value of p the rock can be classified as granite.
Answer to Problem 106SE
The rock can be classified as granite if and only if
Explanation of Solution
Calculation:
The probability of
Thus, the
The probability of
Thus, the
The probability of
Thus, the
Here,
Want to see more full solutions like this?
Chapter 2 Solutions
Student Solutions Manual for Devore's Probability and Statistics for Engineering and the Sciences, 9th


- 9. The concentration function of a random variable X is defined as Qx(h) = sup P(x ≤ X ≤x+h), h>0. Show that, if X and Y are independent random variables, then Qx+y (h) min{Qx(h). Qr (h)).arrow_forward10. Prove that, if (t)=1+0(12) as asf->> O is a characteristic function, then p = 1.arrow_forward9. The concentration function of a random variable X is defined as Qx(h) sup P(x ≤x≤x+h), h>0. (b) Is it true that Qx(ah) =aQx (h)?arrow_forward
- 3. Let X1, X2,..., X, be independent, Exp(1)-distributed random variables, and set V₁₁ = max Xk and W₁ = X₁+x+x+ Isk≤narrow_forward7. Consider the function (t)=(1+|t|)e, ER. (a) Prove that is a characteristic function. (b) Prove that the corresponding distribution is absolutely continuous. (c) Prove, departing from itself, that the distribution has finite mean and variance. (d) Prove, without computation, that the mean equals 0. (e) Compute the density.arrow_forward1. Show, by using characteristic, or moment generating functions, that if fx(x) = ½ex, -∞0 < x < ∞, then XY₁ - Y2, where Y₁ and Y2 are independent, exponentially distributed random variables.arrow_forward
- 1. Show, by using characteristic, or moment generating functions, that if 1 fx(x): x) = ½exarrow_forward1990) 02-02 50% mesob berceus +7 What's the probability of getting more than 1 head on 10 flips of a fair coin?arrow_forward9. The concentration function of a random variable X is defined as Qx(h) sup P(x≤x≤x+h), h>0. = x (a) Show that Qx+b(h) = Qx(h).arrow_forward
- Suppose that you buy a lottery ticket, and you have to pick six numbers from 1 through 50 (repetitions allowed). Which combination is more likely to win: 13, 48, 17, 22, 6, 39 or 1, 2, 3, 4, 5, 6? barrow_forward2 Make a histogram from this data set of test scores: 72, 79, 81, 80, 63, 62, 89, 99, 50, 78, 87, 97, 55, 69, 97, 87, 88, 99, 76, 78, 65, 77, 88, 90, and 81. Would a pie chart be appropriate for this data? ganizing Quantitative Data: Charts and Graphs 45arrow_forward10 Meteorologists use computer models to predict when and where a hurricane will hit shore. Suppose they predict that hurricane Stat has a 20 percent chance of hitting the East Coast. a. On what info are the meteorologists basing this prediction? b. Why is this prediction harder to make than your chance of getting a head on your next coin toss? U anoiaarrow_forward
 Mathematics For Machine TechnologyAdvanced MathISBN:9781337798310Author:Peterson, John.Publisher:Cengage Learning,
 Algebra & Trigonometry with Analytic GeometryAlgebraISBN:9781133382119Author:SwokowskiPublisher:Cengage
 Trigonometry (MindTap Course List)TrigonometryISBN:9781337278461Author:Ron LarsonPublisher:Cengage Learning