
Concept explainers
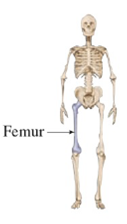
Femur Length and Height Anthropologists use a linear model that relates femur length to height. The model allows an anthropologist to determine the height of an individual when only a partial skeleton (including the femur) is found. In this problem we find the model by analyzing the data on femur length and height for the eight males given in the table.
(a) Make a
(b) Find and graph a linear function that models the data.
(c) An anthropologist finds a femur of length 58 cm. How tall was the person?
 |
|
(a)
To make:
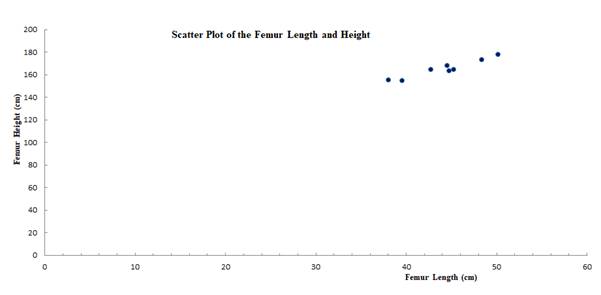
A scatter plot of the data given below:
| Femur length (cm) |
Height (cm) |
| 50.1 | 178.5 |
| 48.3 | 173.6 |
| 45.2 | 164.8 |
| 44.7 | 163.7 |
| 44.5 | 168.3 |
| 42.7 | 165.0 |
| 39.5 | 155.4 |
| 38.0 | 155.8 |
Answer to Problem 1P
Solution:
Explanation of Solution
Approach:
A mathematical model is a mathematical representation of an equation or process. Mathematical models are used to predict or estimate the required output.
Scatter plots are the two dimensional graph that represent the coordinate values of the plotted points.
Calculation:
Given:
| Femur length (cm) |
Height (cm) |
| 50.1 | 178.5 |
| 48.3 | 173.6 |
| 45.2 | 164.8 |
| 44.7 | 163.7 |
| 44.5 | 168.3 |
| 42.7 | 165.0 |
| 39.5 | 155.4 |
| 38.0 | 155.8 |
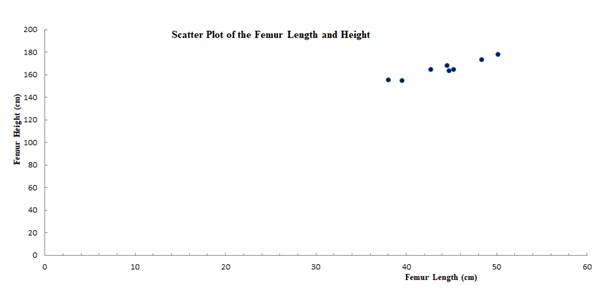
Taking the femur length as x-axis and height as y-axis, we plot the given points to obtain a scatter plot of the data as shown below:
(b)
To find:
The linear function that models the data and graph the function of the scatter plot.
Answer to Problem 1P
Solution:
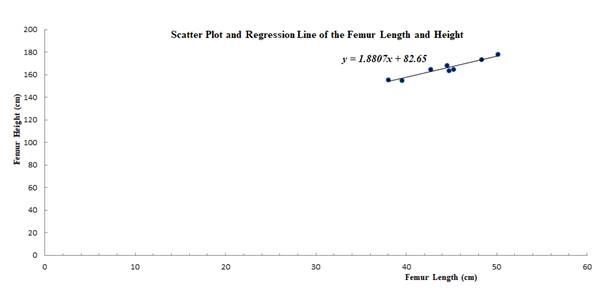
The linear function of the data is found as y=1.88x+82.65.
Explanation of Solution
Approach:
A mathematical model is a mathematical representation of an equation or process. Mathematical models are used to predict or estimate the required output.
Scatter plots are the two dimensional graph that represent the coordinate values of the plotted points.
Calculation:
Given:
| Femur length (cm) |
Height (cm) |
| 50.1 | 178.5 |
| 48.3 | 173.6 |
| 45.2 | 164.8 |
| 44.7 | 163.7 |
| 44.5 | 168.3 |
| 42.7 | 165.0 |
| 39.5 | 155.4 |
| 38.0 | 155.8 |
The scatter plot and the graph of the linear function that models the data are plotted as shown below:
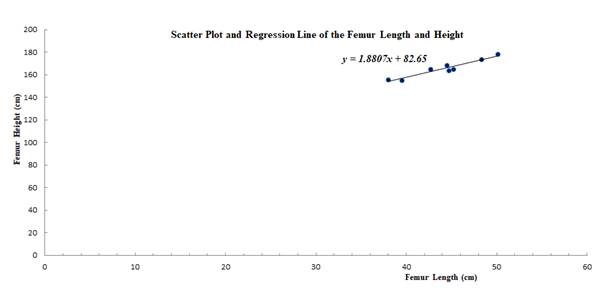
The linear function of the data is found as y=1.8807x+82.65.
(c)
To find:
The height of the femur of length 58 cm from the model of the function.
Answer to Problem 1P
Solution:
The height of the femur was 191.77 cm for a length of 58 cm.
Explanation of Solution
Approach:
A mathematical model is a mathematical representation of an equation or process. Mathematical models are used to predict or estimate the required output.
Scatter plots are the two dimensional graph that represent the coordinate values of the plotted points.
Calculation:
From the data, we find that function is y=1.8807x+82.65.
Substituting the value of x=58, in the above equation, we get
y=1.8807x+82.65
=1.8807(58)+82.65
=191.73
Thus, the height of the femur was 191.73 cm for a length of 58 cm.
Want to see more full solutions like this?
Chapter 1 Solutions
Algebra and Trigonometry (MindTap Course List)
- Solve the system of equation for y using Cramer's rule. Hint: The determinant of the coefficient matrix is -23. - 5x + y − z = −7 2x-y-2z = 6 3x+2z-7arrow_forwarderic pez Xte in z= Therefore, we have (x, y, z)=(3.0000, 83.6.1 Exercise Gauss-Seidel iteration with Start with (x, y, z) = (0, 0, 0). Use the convergent Jacobi i Tol=10 to solve the following systems: 1. 5x-y+z = 10 2x-8y-z=11 -x+y+4z=3 iteration (x Assi 2 Assi 3. 4. x-5y-z=-8 4x-y- z=13 2x - y-6z=-2 4x y + z = 7 4x-8y + z = -21 -2x+ y +5z = 15 4x + y - z=13 2x - y-6z=-2 x-5y- z=-8 realme Shot on realme C30 2025.01.31 22:35 farrow_forwardUse Pascal's triangle to expand the binomial (6m+2)^2arrow_forward
- Listen A falling object travels a distance given by the formula d = 6t + 9t2 where d is in feet and t is the time in seconds. How many seconds will it take for the object to travel 112 feet? Round answer to 2 decimal places. (Write the number, not the units). Your Answer:arrow_forwardSolve by the quadratic formula or completing the square to obtain exact solutions. 2 e 104 OA) -16±3√6 B) 8±√10 O c) -8±√10 OD) 8±3√√6 Uarrow_forwardQuestion 14 (1 point) Listen The frame on a picture is 18 in by 22 in outside and is of uniform width. Using algebraic methods, what is the width of the frame if the inner area of the picture shown is 250 in²2? Write answer to 2 decimal places. (Write the number with no units). 18 in Your Answer: 22 inarrow_forward
- Algebra & Trigonometry with Analytic GeometryAlgebraISBN:9781133382119Author:SwokowskiPublisher:Cengage
 Algebra and Trigonometry (MindTap Course List)AlgebraISBN:9781305071742Author:James Stewart, Lothar Redlin, Saleem WatsonPublisher:Cengage Learning
 Glencoe Algebra 1, Student Edition, 9780079039897...AlgebraISBN:9780079039897Author:CarterPublisher:McGraw Hill
 Functions and Change: A Modeling Approach to Coll...AlgebraISBN:9781337111348Author:Bruce Crauder, Benny Evans, Alan NoellPublisher:Cengage Learning
 Trigonometry (MindTap Course List)TrigonometryISBN:9781337278461Author:Ron LarsonPublisher:Cengage Learning


