Concept explainers
Videos
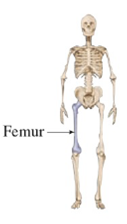
Femur Length and Height Anthropologists use a linear model that relates femur length to height. The model allows an anthropologist to determine the height of an individual when only a partial skeleton (including the femur) is found. In this problem we find the model by analyzing the data on femur length and height for the eight males given in the table.
(a) Make a
(b) Find and graph a linear function that models the data.
(c) An anthropologist finds a femur of length
 |
|
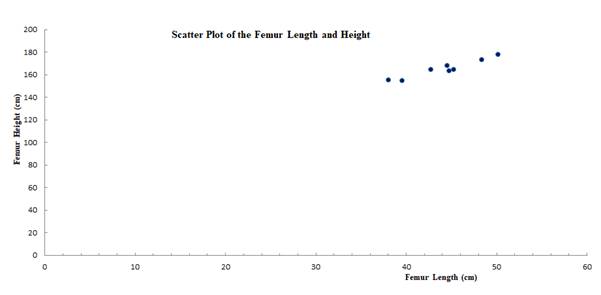
(a)
To make:
A scatter plot of the data given below:
| Femur length (cm) |
Height (cm) |
| 50.1 | 178.5 |
| 48.3 | 173.6 |
| 45.2 | 164.8 |
| 44.7 | 163.7 |
| 44.5 | 168.3 |
| 42.7 | 165.0 |
| 39.5 | 155.4 |
| 38.0 | 155.8 |
Answer to Problem 1P
Solution:
Explanation of Solution
Approach:
A mathematical model is a mathematical representation of an equation or process. Mathematical models are used to predict or estimate the required output.
Scatter plots are the two dimensional graph that represent the coordinate values of the plotted points.
Calculation:
Given:
| Femur length (cm) |
Height (cm) |
| 50.1 | 178.5 |
| 48.3 | 173.6 |
| 45.2 | 164.8 |
| 44.7 | 163.7 |
| 44.5 | 168.3 |
| 42.7 | 165.0 |
| 39.5 | 155.4 |
| 38.0 | 155.8 |
Taking the femur length as

(b)
To find:
The linear function that models the data and graph the function of the scatter plot.
Answer to Problem 1P
Solution:
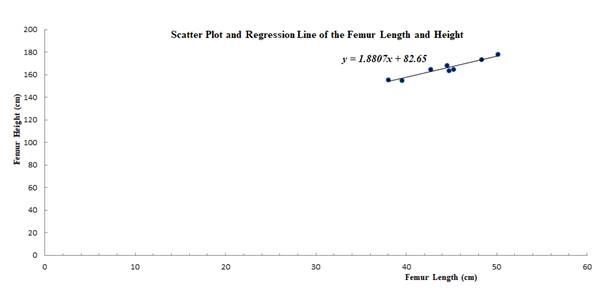
The linear function of the data is found as
Explanation of Solution
Approach:
A mathematical model is a mathematical representation of an equation or process. Mathematical models are used to predict or estimate the required output.
Scatter plots are the two dimensional graph that represent the coordinate values of the plotted points.
Calculation:
Given:
| Femur length (cm) |
Height (cm) |
| 50.1 | 178.5 |
| 48.3 | 173.6 |
| 45.2 | 164.8 |
| 44.7 | 163.7 |
| 44.5 | 168.3 |
| 42.7 | 165.0 |
| 39.5 | 155.4 |
| 38.0 | 155.8 |
The scatter plot and the graph of the linear function that models the data are plotted as shown below:

The linear function of the data is found as
(c)
To find:
The height of the femur of length
Answer to Problem 1P
Solution:
The height of the femur was
Explanation of Solution
Approach:
A mathematical model is a mathematical representation of an equation or process. Mathematical models are used to predict or estimate the required output.
Scatter plots are the two dimensional graph that represent the coordinate values of the plotted points.
Calculation:
From the data, we find that function is
Substituting the value of
Thus, the height of the femur was
Want to see more full solutions like this?
Chapter 1 Solutions
Algebra and Trigonometry (MindTap Course List)


- How much is the circumference of a circle whose diameter is 7 feet?C =π darrow_forwardHow to solve 2542/64.132arrow_forwardAssume that you fancy polynomial splines, while you actually need ƒ(t) = e²/3 – 1 for t€ [−1, 1]. See the figure for a plot of f(t). Your goal is to approximate f(t) with an inter- polating polynomial spline of degree d that is given as sa(t) = • Σk=0 Pd,k bd,k(t) so that sd(tk) = = Pd,k for tk = −1 + 2 (given d > 0) with basis functions bd,k(t) = Σi±0 Cd,k,i = • The special case of d 0 is trivial: the only basis function b0,0 (t) is constant 1 and so(t) is thus constant po,0 for all t = [−1, 1]. ...9 The d+1 basis functions bd,k (t) form a ba- sis Bd {ba,o(t), ba,1(t), bd,d(t)} of the function space of all possible sα (t) functions. Clearly, you wish to find out, which of them given a particular maximal degree d is the best-possible approximation of f(t) in the least- squares sense. _ 1 0.9 0.8 0.7 0.6 0.5 0.4 0.3 0.2 0.1 0 -0.1 -0.2 -0.3 -0.4 -0.5 -0.6 -0.7 -0.8 -0.9 -1 function f(t) = exp((2t)/3) - 1 to project -1 -0.9 -0.8 -0.7 -0.6 -0.5 -0.4 -0.3 -0.2 -0.1 0 0.1 0.2 0.3 0.4 0.5…arrow_forward
- An image processor considered a 750×750 pixels large subset of an image and converted it into gray-scale, resulting in matrix gIn - a false-color visualization of gIn is shown in the top-left below. He prepared a two-dim. box filter f1 as a 25×25 matrix with only the 5×5 values in the middle being non-zero – this filter is shown in the top-middle position below. He then convolved £1 with itself to get £2, before convolving £2 with itself to get f3. In both of the steps, he maintained the 25×25 size. Next, he convolved gIn with £3 to get gl. Which of the six panels below shows g1? Argue by explaining all the steps, so far: What did the image processor do when preparing ₤3? What image processing operation (from gin to g1) did he prepare and what's the effect that can be seen? Next, he convolved the rows of f3 with filter 1/2 (-1, 8, 0, -8, 1) to get f4 - you find a visualization of filter f 4 below. He then convolved gIn with f4 to get g2 and you can find the result shown below. What…arrow_forward3ur Colors are enchanting and elusive. A multitude of color systems has been proposed over a three-digits number of years - maybe more than the number of purposes that they serve... - Everyone knows the additive RGB color system – we usually serve light-emitting IT components like monitors with colors in that system. Here, we use c = (r, g, b) RGB with r, g, bЄ [0,1] to describe a color c. = T For printing, however, we usually use the subtractive CMY color system. The same color c becomes c = (c, m, y) CMY (1-c, 1-m, 1-y) RGB Note how we use subscripts to indicate with coordinate system the coordinates correspond to. Explain, why it is not possible to find a linear transformation between RGB and CMY coordinates. Farbenlehr c von Goethe Erster Band. Roſt einen Defte mit fergen up Tübingen, is et 3. Cotta'fden Babarblung. ISIO Homogeneous coordinates give us a work-around: If we specify colors in 4D, instead, with the 4th coordinate being the homogeneous coordinate h so that every actual…arrow_forwardCan someone provide an answer & detailed explanation please? Thank you kindly!arrow_forward
- Given the cubic function f(x) = x^3-6x^2 + 11x- 6, do the following: Plot the graph of the function. Find the critical points and determine whether each is a local minimum, local maximum, or a saddle point. Find the inflection point(s) (if any).Identify the intervals where the function is increasing and decreasing. Determine the end behavior of the graph.arrow_forwardGiven the quadratic function f(x) = x^2-4x+3, plot the graph of the function and find the following: The vertex of the parabola .The x-intercepts (if any). The y-intercept. Create graph also before solve.arrow_forwardwhat model best fits this dataarrow_forward
- Round as specified A) 257 down to the nearest 10’s place B) 650 to the nearest even hundreds, place C) 593 to the nearest 10’s place D) 4157 to the nearest hundreds, place E) 7126 to the nearest thousand place arrow_forwardEstimate the following products in two different ways and explain each method  A) 52x39 B) 17x74 C) 88x11 D) 26x42arrow_forwardFind a range estimate for these problems A) 57x1924 B) 1349x45 C) 547x73951arrow_forward
 Algebra & Trigonometry with Analytic GeometryAlgebraISBN:9781133382119Author:SwokowskiPublisher:Cengage
 Algebra and Trigonometry (MindTap Course List)AlgebraISBN:9781305071742Author:James Stewart, Lothar Redlin, Saleem WatsonPublisher:Cengage Learning
 Glencoe Algebra 1, Student Edition, 9780079039897...AlgebraISBN:9780079039897Author:CarterPublisher:McGraw Hill
 Functions and Change: A Modeling Approach to Coll...AlgebraISBN:9781337111348Author:Bruce Crauder, Benny Evans, Alan NoellPublisher:Cengage Learning
 Trigonometry (MindTap Course List)TrigonometryISBN:9781337278461Author:Ron LarsonPublisher:Cengage Learning