Concept explainers
Videos
a)
To graph:
The
b)
To find:
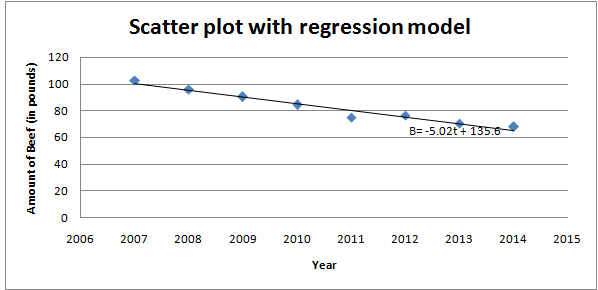
The equation of the least squares regression line that fits the data of the amount of beef produced on private farms for the years from 2007 through 2014 and to graph the model and the scatter plot in the same graph and to interpret how closely the model represents the data.
Solution:
The least squares regression equation is
The model represents a very close relationship with the data.
Explanation:
Definition:
Regression is a statistical method used to model the relationship between two sets of variables. The least squares equation is defined as,
Here, X is the independent variable, Y is the dependent variable, a is the y-intercept and b is the slope of the line.
Calculation:
Consider the provided information of the amount B (in millions of pounds) of beef produced on private farms for years from 2007 through 2017.
Assume that t represents the year with
Excel can be used to determine the least squares regression equation. The steps followed to construct the scatter plot are:
Step 1: Open Excel worksheet. Enter the provided data of years and amount of beef.
Step 2: In the menu bar, select Data➔Data Analysis.
Step 3: In the dialog that appears, select Regression. Click ‘Ok’.
Step 4: In the window that appears, select the Input Y-Range and Input X-Range and click Ok.
The least squares regression equation is obtained as,
Now, graph the model with the scatter plot in the same graph. The steps followed in Excel are:
Step 1: Open the obtained scatter plot in part (a).
Step 2: Right click on the graph and select Add Trendline from the dropdown list.
Step 3: Again Right click on the trend line added and select Format Trendline.
Step 4: In the window that appears select “Display Equation on Chart”. Click Ok.
The graph is obtained as:
The obtained graph shows the scatter plot and the regression model on the same graph. The graph shows that the data points are very close to the regression line. This indicates that there is a close relationship between the data and the model.
Want to see the full answer?
Check out a sample textbook solution
Chapter 1 Solutions
Precalculus (MindTap Course List)


- Evaluate F³ - dr where ♬ = (4z, -4y, x), and C' is given by (t) = (sin(t), t, cos(t)), 0≤t≤ñ .arrow_forwardMid-Term Review Find the formula for (f + g)(x). f(x) = x² - 10x + 25 and g(x) = x² - 10x + 24 (f + g) (x) = [ 2 ]x² X + DELL Skip Sarrow_forwardCalculus III May I please have some elaborations on Example 2 part a? Thank you.arrow_forward
- 1. A bicyclist is riding their bike along the Chicago Lakefront Trail. The velocity (in feet per second) of the bicyclist is recorded below. Use (a) Simpson's Rule, and (b) the Trapezoidal Rule to estimate the total distance the bicyclist traveled during the 8-second period. t 0 2 4 6 8 V 10 15 12 10 16 2. Find the midpoint rule approximation for (a) n = 4 +5 x²dx using n subintervals. 1° 2 (b) n = 8 36 32 28 36 32 28 24 24 20 20 16 16 12 8- 4 1 2 3 4 5 6 12 8 4 1 2 3 4 5 6arrow_forward= 5 37 A 4 8 0.5 06 9arrow_forwardConsider the following system of equations, Ax=b : x+2y+3z - w = 2 2x4z2w = 3 -x+6y+17z7w = 0 -9x-2y+13z7w = -14 a. Find the solution to the system. Write it as a parametric equation. You can use a computer to do the row reduction. b. What is a geometric description of the solution? Explain how you know. c. Write the solution in vector form? d. What is the solution to the homogeneous system, Ax=0?arrow_forward
- 2. Find a matrix A with the following qualities a. A is 3 x 3. b. The matrix A is not lower triangular and is not upper triangular. c. At least one value in each row is not a 1, 2,-1, -2, or 0 d. A is invertible.arrow_forwardFind the exact area inside r=2sin(2\theta ) and outside r=\sqrt(3)arrow_forwardA 20 foot ladder rests on level ground; its head (top) is against a vertical wall. The bottom of the ladder begins by being 12 feet from the wall but begins moving away at the rate of 0.1 feet per second. At what rate is the top of the ladder slipping down the wall? You may use a calculator.arrow_forward
 Glencoe Algebra 1, Student Edition, 9780079039897...AlgebraISBN:9780079039897Author:CarterPublisher:McGraw Hill
 Mathematics For Machine TechnologyAdvanced MathISBN:9781337798310Author:Peterson, John.Publisher:Cengage Learning,
 Holt Mcdougal Larson Pre-algebra: Student Edition...AlgebraISBN:9780547587776Author:HOLT MCDOUGALPublisher:HOLT MCDOUGAL
 Big Ideas Math A Bridge To Success Algebra 1: Stu...AlgebraISBN:9781680331141Author:HOUGHTON MIFFLIN HARCOURTPublisher:Houghton Mifflin Harcourt
 Elementary Geometry for College StudentsGeometryISBN:9781285195698Author:Daniel C. Alexander, Geralyn M. KoeberleinPublisher:Cengage Learning