
Concept explainers
Videos
Construct amplitude and phase line spectra for Prob. 19.4.
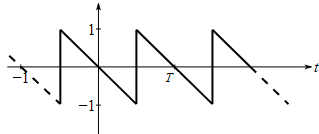
To graph: The amplitude and phase line spectra for the sawtooth wave as shown in the following figure,
Explanation of Solution
Given Information: The sawtooth wave given in the following figure,
Formula used:
Consider
then the Fourier series expansion of the function,
And the coefficients are defined by,
Alternatively, the Fourier series can also be written as,
Here, the amplitude
Plot
Graph:
Consider the sawtooth wave given in the following figure,
Therefore, the sawtooth wave is a periodic function
Therefore, the sawtooth wave,
Therefore, the Fourier series expansion of this function is,
In the above expression, the coefficients are defined by,
Now, find
Consider,
Hence,
Further,
Therefore,
Now, find
Consider,
Hence,
Further,
Thus,
Hence, the coefficients of the Fourier series expansions are,
That is,
Consider,
Thus, the amplitude of the
Furthermore, consider,
As
As
Therefore,
Thus, the phases corresponding to
Use the following MATLAB code to construct the amplitude plot.
Execute the above code to obtain the amplitude plot as,
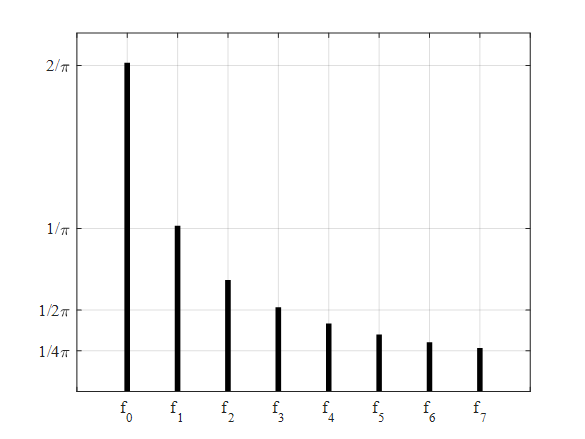
Interpretation: The above plot shows the amplitude plot for the sawtooth wave as shown in the figure provided.
Use the following MATLAB file can be used to construct the phase plot.
Execute the above code to obtain the plot as,
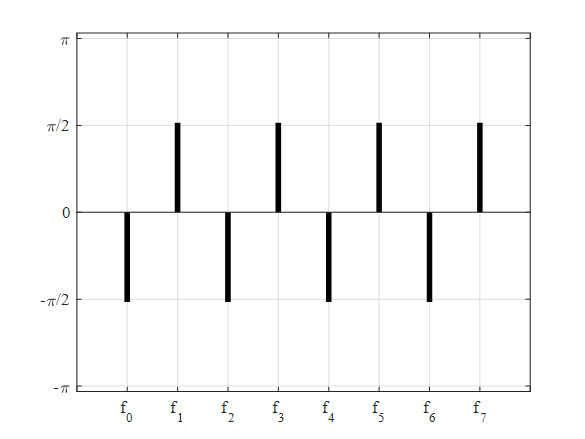
Interpretation: The above plot shows the phase line spectra for the sawtooth wave as shown in the figure provided.
Want to see more full solutions like this?
Chapter 19 Solutions
Numerical Methods for Engineers


- In preparing for the upcoming holiday season, Fresh Toy Company (FTC) designed a new doll called The Dougie that teaches children how to dance. The fixed cost to produce the doll is $100,000. The variable cost, which includes material, labor, and shipping costs, is $31 per doll. During the holiday selling season, FTC will sell the dolls for $39 each. If FTC overproduces the dolls, the excess dolls will be sold in January through a distributor who has agreed to pay FTC $10 per doll. Demand for new toys during the holiday selling season is extremely uncertain. Forecasts are for expected sales of 60,000 dolls with a standard deviation of 15,000. The normal probability distribution is assumed to be a good description of the demand. FTC has tentatively decided to produce 60,000 units (the same as average demand), but it wants to conduct an analysis regarding this production quantity before finalizing the decision. (a) Determine the equation for computing FTC's profit for given values of the…arrow_forwardTo generate leads for new business, Gustin Investment Services offers free financial planning seminars at major hotels in Southwest Florida. Gustin conducts seminars for groups of 25 individuals. Each seminar costs Gustin $3,700, and the average first-year commission for each new account opened is $5,200. Gustin estimates that for each individual attending the seminar, there is a 0.01 probability that individual will open a new account. (a) Determine the equation for computing Gustin's profit per seminar, given values of the relevant parameters. Profit = (3,700 x 5,200) - New Accounts Opened Profit = 5,200 - (New Accounts Opened x 3,700) Profit = (New Accounts Opened x 3,700) - 5,200 Profit = New Accounts Opened - (5,200 × 3,700) Profit = (New Accounts Opened x 5,200) - 3,700 (b) What type of random variable is the number of new accounts opened? Hint: Review Appendix 12.1 for descriptions of various types of probability distributions. continuous integer uniform normal discrete uniform…arrow_forwardStrassel Investors buys real estate, develops it, and resells it for a profit. A new property is available, and Bud Strassel, the president and owner of Strassel Investors, believes if he purchases and develops this property, it can then be sold for $158,000. The current property owner has asked for bids and stated that the property will be sold for the highest bid in excess of $100,000. Two competitors will be submitting bids for the property. Strassel does not know what the competitors will bid, but he assumes for planning purposes that the amount bid by each competitor will be uniformly distributed between $100,000 and $148,000. (a) What is the estimate of the probability Strassel will be able to obtain the property using a bid of $128,000? (Use at least 5,000 trials. Round your answer three decimal places.) (b) How much does Strassel need to bid to be assured of obtaining the property? $128,000 $138,000 $148,000 (c) Use the simulation model to compute the profit for each trial of…arrow_forward
- Grear Tire Company has produced a new tire with an estimated mean lifetime mileage of 34,500 miles. Management also believes that the standard deviation is 4,500 miles and that tire mileage is normally distributed. To promote the new tire, Grear has offered to refund a portion of the purchase price if the tire fails to reach 30,000 miles before the tire needs to be replaced. Specifically, for tires with a lifetime below 30,000 miles, Grear will refund a customer $1 per 100 miles short of 30,000. Construct a simulation model to answer the following questions. (Use at least 1,000 trials.) (a) For each tire sold, what is the average cost of the promotion (in $)? (Round your answer to two decimal places.) (b) What is the probability that Grear will refund more than $25 for a tire? (Round your answer to three decimal places.)arrow_forwardMajor League Baseball's World Series is a maximum of seven games, with the winner being the first team to win four games. Assume that the Atlanta Braves and the Minnesota Twins are playing in the World Series and that the first two games are to be played in Atlanta, the next three games at the Twins' ballpark, and the last two games, if necessary, back in Atlanta. Taking into account the projected starting pitchers for each game and the home field advantage, suppose the probabilities of Atlanta winning each game are as follows. Game 1 2 3 4 5 6 7 Probability of Win 0.61 0.54 0.47 0.46 0.47 0.56 0.49 Construct a simulation model in which whether Atlanta wins or loses each game is a random variable. Use the model to answer the following questions. (Use at least 1,000 trials.) (a) What is the average number of games played regardless of winner? (Round your answer to one decimal place.) games (b) What is the probability that the Atlanta Braves win the World Series? (Round your answer to…arrow_forward1 Brinkley 2 A B с D E F G H I J 3 Parameters 4 Selling Price 5 Procurement Cost 6 Labor Cost 7 Transportation Cost 8 9 Procurement Cost 10 Lower End of Interval Upper End of Interval Cost Probability 11 $10.00 12 $11.00 0.25 0.45 13 $12.00 0.3 14 15 Labor Cost 16 Lower End of Interval Upper End of Interval Cost Probability 17 $20.00 0.1 18 $22.00 0.25 19 $24.00 0.35 20 $25.00 0.3 21 22 Transportation Cost 23 Lower End of Interval Upper End of Interval Cost Probability 24 25 $3.00 $5.00 0.75 0.25 26 27 Model 28 Profit Per Unit 29 30 Simulation Trial Procurement Cost Labor Cost Transportation Cost Profit Per Unit Summary Statistics 31 1 Mean Profit Per Unit #DIV/0! 32 2 P(Profit <$5) #DIV/0! 83 3 34 4 35 5 36 6 37 7 38 8 39 9 40 10arrow_forward
- Model File Available: Download WeddingIMS.xlsx The wedding date for a couple is quickly approaching, and the wedding planner must provide the caterer an estimate of how many people will attend the reception so that the appropriate quantity of food is prepared for the buffet. The following table contains information on the number of RSVP guests for the 145 invitations. Unfortunately, the number of guests does not always correspond to the number of RSVPed guests. Based on her experience, the wedding planner knows it is extremely rare for guests to attend a wedding if they notified that they will not be attending. Therefore, the wedding planner will assume that no one from these 50 invitations will attend. The wedding planner estimates that the each of the 25 guests planning to come solo has a 74% chance of attending alone, a 20% chance of not attending, and a 6% chance of bringing a companion. For each of the 60 RSVPs who plan to bring a companion, there is a 90% chance that they will…arrow_forwardProve that f: f →> R 16 One-to- one.arrow_forwardUse mathematical induction to prove the following statement: For all natural numbers n, 5 divides 6^n - 1 (show every step in detail)arrow_forward
- Use mathematical induction to prove the following statement: For all natural numbers n, 5 divides 6^n - 1arrow_forwardthe set of all preimages of 2 isarrow_forwardWhich diagram(s) represent the following relationships An injective function from A to B? A surjective function from A to B? An injective function from B to A? A surjective function from B to A?arrow_forward
 Trigonometry (MindTap Course List)TrigonometryISBN:9781337278461Author:Ron LarsonPublisher:Cengage Learning
 Algebra & Trigonometry with Analytic GeometryAlgebraISBN:9781133382119Author:SwokowskiPublisher:Cengage
 Mathematics For Machine TechnologyAdvanced MathISBN:9781337798310Author:Peterson, John.Publisher:Cengage Learning,
 Algebra: Structure And Method, Book 1AlgebraISBN:9780395977224Author:Richard G. Brown, Mary P. Dolciani, Robert H. Sorgenfrey, William L. ColePublisher:McDougal Littell