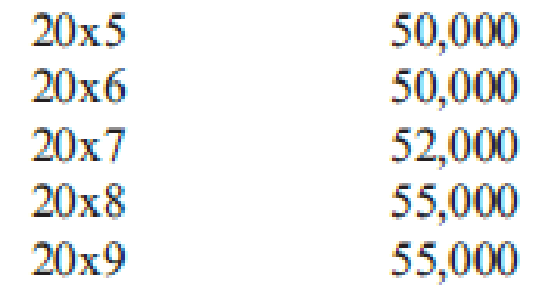
Jonfran Company manufactures three different models of paper shredders including the waste container, which serves as the base. While the shredder heads are different for all three models, the waste container is the same. The number of waste containers that Jonfran will need during the following years is estimated as follows:

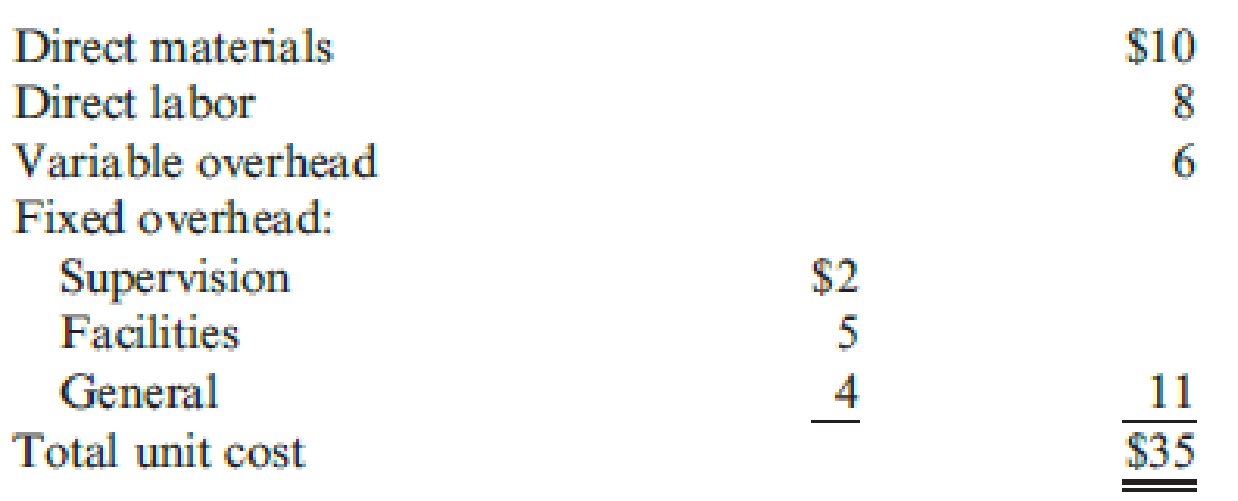
The equipment used to manufacture the waste container must be replaced because it is broken and cannot be repaired. The new equipment would have a purchase price of $945,000 with terms of 2/10, n/30; the company’s policy is to take all purchase discounts. The freight on the equipment would be $11,000, and installation costs would total $22,900. The equipment would be purchased in December 20x4 and placed into service on January 1, 20x5. It would have a five-year economic life and would be treated as three-year property under MACRS. This equipment is expected to have a salvage value of $12,000 at the end of its economic life in 20x9. The new equipment would be more efficient than the old equipment, resulting in a 25 percent reduction in both direct materials and variable
The old equipment is fully

Jonfran uses a plantwide fixed overhead rate in its operations. If the waste containers are purchased outside, the salary and benefits of one supervisor, included in fixed overhead at $45,000, would be eliminated. There would be no other changes in the other cash and noncash items included in fixed overhead except depreciation on the new equipment.
Jonfran is subject to a 40 percent tax rate. Management assumes that all
Required:
- 1. Prepare a schedule of cash flows for the make alternative. Calculate the
NPV of the make alternative. - 2. Prepare a schedule of cash flows for the buy alternative. Calculate the NPV of the buy alternative.
- 3. Which should Jonfran do—make or buy the containers? What qualitative factors should be considered? (CMA adapted)
1.
Calculate the cash flow and net present value (NVP) for make alternative of Company J.
Explanation of Solution
Cash inflows: The amount of cash received by a company from the operating, investing, and financing activities of the business during a certain period is referred to as cash inflow.
Cash outflows: The amount of cash paid by a company for the operating, investing, and financing activities of the business during a certain period is referred to as cash outflow.
Net present value method (NVP): Net present value method is the method which is used to compare the initial cash outflow of investment with the present value of its cash inflows. In the net present value, the interest rate is desired by the business based on the net income from the investment, and it is also called as the discounted cash flow method.
Calculate the cash flow and net present value (NVP) for make alternative of Company J as follows:
| Year |
Cash inflow (9) (A) | Present value factor @12% (B) |
Present value |
| 2015 | $ -499,013 | 0.893 | -$ 445,619 |
| 2016 | $ -456,312 | 0.797 | -$ 363,681 |
| 2017 | $ -594,130 | 0.712 | -$ 423,021 |
| 2018 | $ -658,546 | 0.636 | -$ 418,835 |
| 2019 | $ -679,800 | 0.567 | -$ 385,447 |
| Total present value | -$ 2,036,602 | ||
| Less: Cash outflow for investment (7) | $ 956,600 | ||
| Net present value | ($ 2,993,202) | ||
Table (1)
Working note (1):
Calculate the variable cost per unit.
Working note (2):
Calculate the variable cost after tax for each year.
Year 2015:
Year 2016:
Year 2017:
Year 2018:
Year 2019:
Working note (3):
Calculate the fixed cost after tax for each year.
Working note (4):
Calculate the operating expense for each year.
| Year | Variable cost (2) (E) |
Fixed cost (3) (F) |
Total operating expense |
| 2015 | $600,000 | $27,000 | $627,000 |
| 2016 | $600,000 | $27,000 | $627,000 |
| 2017 | $624,000 | $27,000 | $651,000 |
| 2018 | $660,000 | $27,000 | $687,000 |
| 2019 | $660,000 | $27,000 | $687,000 |
Table (2)
Working note (5):
Calculate the initial investment.
Working note (6):
Calculate the depreciation expense after tax for each year.
| Depreciation Schedule | ||||
| Year |
MACRS Percentage (W) |
Depreciation |
Tax Rate (Y) |
Depreciation Tax Shield |
| 2015 | 33.33% | $319,968 | 40% | $127,987 |
| 2016 | 44.45% | $426,720 | 40% | $170,688 |
| 2017 | 14.81% | $142,176 | 40% | $56,870 |
| 2018 | 7.41% | $71,136 | 40% | $28,454 |
| Total | $960,000 | |||
Table (3)
Working note (7):
Calculate the cash outflow for new equipment.
Working note (8):
Calculate the salvage value after tax.
Working note (9):
Calculate the cash inflow of new equipment each year.
| Year |
Operating expense after tax (P)(4) | Depreciation expenses after tax (Q) (6) | Salvage value after tax (R) (8) |
Net cash inflow |
| 2015 | ($627,000) | $127,987 | ($499,013) | |
| 2016 | ($627,000) | $170,688 | ($456,312) | |
| 2017 | ($651,000) | $56,870 | ($594,130) | |
| 2018 | ($687,000) | $28,454 | ($658,546) | |
| 2019 | ($687,000) | $7,200 | ($679,800) |
Table (4)
2.
Calculate the cash flow and net present value (NVP) for buy alternative of Company J.
Explanation of Solution
Calculate the cash flow and net present value (NVP) for buy alternative of Company J as follows:
| Year |
Cash inflow (10) (A) | Present value factor @12% (B) (11) |
Present value |
| 2015 | $ -810,000 | 0.893 | -$ 723,330 |
| 2016 | $ -810,000 | 0.797 | -$ 645,570 |
| 2017 | $ -842,400 | 0.712 | -$ 599,789 |
| 2018 | $ -891,000 | 0.636 | -$ 566,676 |
| 2019 | $ -891,000 | 0.567 | -$ 505,197 |
| Total present value | -$ 3,040,562 | ||
| Less: Salvage value (11) | -$ 600 | ||
| Net present value | -$ 3,039,962 | ||
Table (5)
Working note (10):
Calculate the cash inflow for each year.
Year 2015:
Year 2016:
Year 2017:
Year 2018:
Year 2019:
Working note (11):
Calculate the salvage value after tax for year 2014.
3.
Indicate whether company J should make the containers or buy the containers, and explain the quantitative factors that should be considered for the capital investment analysis.
Explanation of Solution
Indicate whether company J should make the containers or buy the containers, and explain the quantitative factors that should be considered for the capital investment analysis as follows:
In this case, company J should make the containers because make decision ($2,993,203) has less cost than the buy decision ($3,039,662). Qualitative factors of capital investment analysis are,
- Reliability of supplier,
- Quality of the product,
- Stability of purchasing price,
- Labor relations, and
- Community relation.
Want to see more full solutions like this?
Chapter 19 Solutions
EBK CORNERSTONES OF COST MANAGEMENT
- Using the Hofstede Country Comparison ToolLinks to an external site., compare your nation to two other nations on Hofstede’s dimensions. Based on what you know about these national cultures and the cultural dimensions discussed in class, how do you interpret the accuracy of this information?arrow_forwardI need help with this solution for accountingarrow_forwardGeneral accountingarrow_forward
 Cornerstones of Cost Management (Cornerstones Ser...AccountingISBN:9781305970663Author:Don R. Hansen, Maryanne M. MowenPublisher:Cengage Learning
