
Concept explainers
Videos
A process engineer is considering two sampling plans. In the first, a sample of 10 will be selected and the lot accepted if 3 or fewer are found defective. In the second, the
Develop the OC curve for each to compare the probability of acceptance for lots that are 5, 10, 20, and 30% defective.
Explain which of the plans would be recommend if you were the supplier.
Answer to Problem 31CE
Output using MINITAB software is given below:
Explanation of Solution
Calculation:
Let x denotes the accepting lots.
First sampling plan:
For 5% defective:
The probability of accepting lots that is 5% defective is,
Compute the probability value for x less than or equal to 3 using MINITAB.
Step by step procedure to obtain probability using MINITAB software is given as,
- Choose Calc > Probability Distributions > Binomial Distribution.
- Choose Cumulative probability.
- Enter Number of trials as 10 and Event probability as 0.05.
- In Input constant, enter 3.
- Click OK.
Output using MINITAB software is given below:
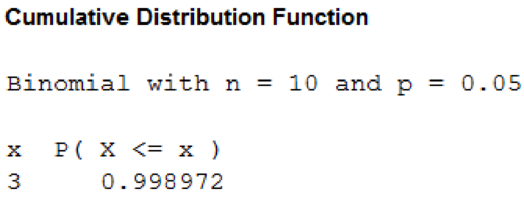
From the MINITAB output, the probability value is 0.999. That is,
For 10% defective:
The probability of accepting lots that is 10% defective is,
Compute the probability value for x less than or equal to 3 using MINITAB.
Step by step procedure to obtain probability using MINITAB software is given as,
- Choose Calc > Probability Distributions > Binomial Distribution.
- Choose Cumulative probability.
- Enter Number of trials as 10 and Event probability as 0.10.
- In Input constant, enter 3.
- Click OK.
Output using MINITAB software is given below:
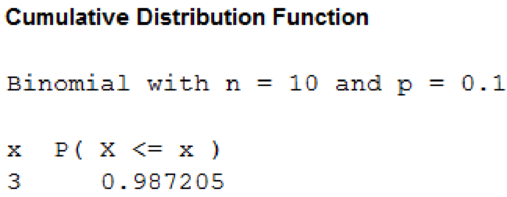
From the MINITAB output, the probability value is 0.987. That is,
For 20% defective:
The probability of accepting lots that is 20% defective is,
Compute the probability value for x less than or equal to 3 using MINITAB.
Step by step procedure to obtain probability using MINITAB software is given as,
- Choose Calc > Probability Distributions > Binomial Distribution.
- Choose Cumulative probability.
- Enter Number of trials as 10 and Event probability as 0.20.
- In Input constant, enter 3.
- Click OK.
Output using MINITAB software is given below:
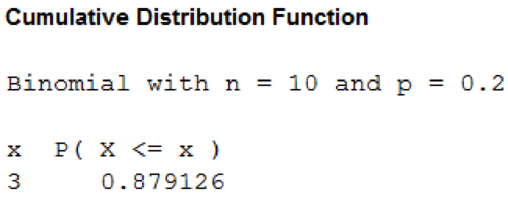
From the MINITAB output, the probability value is 0.879. That is,
For 30% defective:
The probability of accepting lots that is 30% defective is,
Compute the probability value for x less than or equal to 3 using MINITAB.
Step by step procedure to obtain probability using MINITAB software is given as,
- Choose Calc > Probability Distributions > Binomial Distribution.
- Choose Cumulative probability.
- Enter Number of trials as 10 and Event probability as 0.30.
- In Input constant, enter 3.
- Click OK.
Output using MINITAB software is given below:
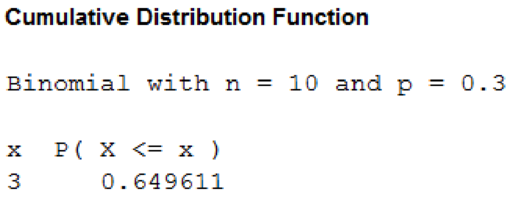
From the MINITAB output, the probability value is 0.649. That is,
The probability of accepting lots that are 5%, 10%, 20%, and 30% defective is,
| Defective Percent | Probability of acceptance |
| 5 | 0.999 |
| 10 | 0.987 |
| 20 | 0.879 |
| 30 | 0.649 |
Second sampling plan:
For 5% defective:
The probability of accepting lots that is 5% defective is,
Compute the probability value for x less than or equal to 5 using MINITAB.
Step by step procedure to obtain probability using MINITAB software is given as,
- Choose Calc > Probability Distributions > Binomial Distribution.
- Choose Cumulative probability.
- Enter Number of trials as 20 and Event probability as 0.05.
- In Input constant, enter 5.
- Click OK.
Output using MINITAB software is given below:
From the MINITAB output, the probability value is 0.999. That is,
For 10% defective:
The probability of accepting lots that is 10% defective is,
Compute the probability value for x less than or equal to 5 using MINITAB.
Step by step procedure to obtain probability using MINITAB software is given as,
- Choose Calc > Probability Distributions > Binomial Distribution.
- Choose Cumulative probability.
- Enter Number of trials as 20 and Event probability as 0.10.
- In Input constant, enter 5.
- Click OK.
Output using MINITAB software is given below:
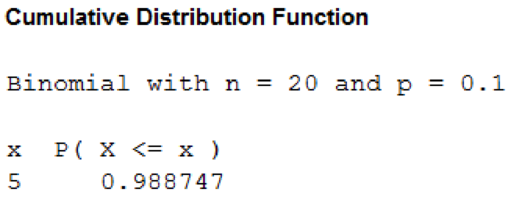
From the MINITAB output, the probability value is 0.988. That is,
For 20% defective:
The probability of accepting lots that is 20% defective is,
Compute the probability value for x less than or equal to 5 using MINITAB.
Step by step procedure to obtain probability using MINITAB software is given as,
- Choose Calc > Probability Distributions > Binomial Distribution.
- Choose Cumulative probability.
- Enter Number of trials as 20 and Event probability as 0.20.
- In Input constant, enter 5.
- Click OK.
Output using MINITAB software is given below:
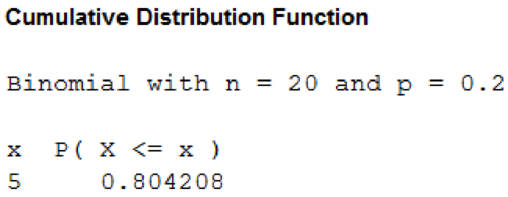
From the MINITAB output, the probability value is 0.804. That is,
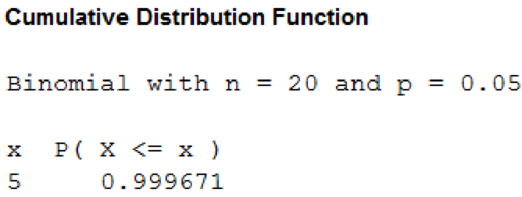
For 30% defective:
The probability of accepting lots that is 30% defective is,
Compute the probability value for x less than or equal to 5 using MINITAB.
Step by step procedure to obtain probability using MINITAB software is given as,
- Choose Calc > Probability Distributions > Binomial Distribution.
- Choose Cumulative probability.
- Enter Number of trials as 20 and Event probability as 0.30.
- In Input constant, enter 5.
- Click OK.
Output using MINITAB software is given below:
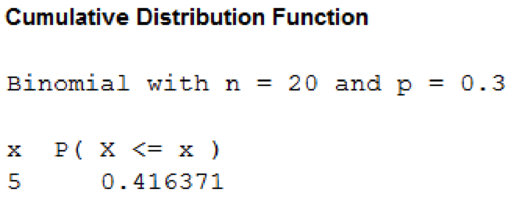
From the MINITAB output, the probability value is 0.416. That is,
The probability of accepting lots that are 5%, 10%, 20%, and 30% defective is,
| Defective Percent | Probability of acceptance |
| 5 | 0.999 |
| 10 | 0.988 |
| 20 | 0.804 |
| 30 | 0.416 |
Step by step procedure to obtain OC curve using MINITAB software is given as,
- Choose Graph > Scatterplot > select With Connect Line.
- In Y variable enter the column First sample probability.
- In X variable enter the column Defective percent.
- In Y variable enter the column Second sample probability.
- In X variable enter the column Defective percent.
- Select Multiple Graphs.
- Mark on Overlaid on the same graph under Show pairs of graph varibales.
- Click OK.
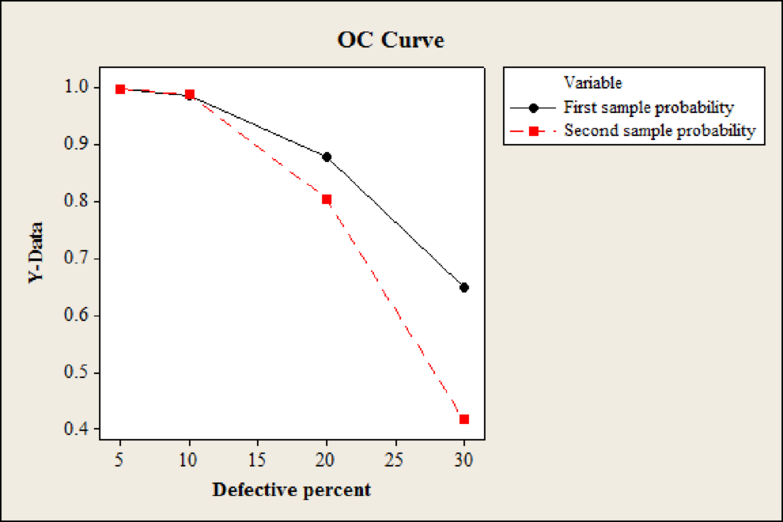
From the output, the black line represents the operating characteristic curve for the first plan and the red line represents the operating characteristic curve for the second plan. The probability of acceptance is more for first plan when compared with second plan because the probability line is above the probability line of second plan.
Since the probability of acceptance is higher for the first plan, the supplier should prefer first plan. But, it the supplier also takes the quality into account then supplier would prefer second plan because the percentage of defects is very low when compared to first plan.
Want to see more full solutions like this?
Chapter 19 Solutions
Loose Leaf for Statistical Techniques in Business and Economics (Mcgraw-hill/Irwin Series in Operations and Decision Sciences)


- I need help with this problem and an explanation of the solution for the image described below. (Statistics: Engineering Probabilities)arrow_forward310015 K Question 9, 5.2.28-T Part 1 of 4 HW Score: 85.96%, 49 of 57 points Points: 1 Save of 6 Based on a poll, among adults who regret getting tattoos, 28% say that they were too young when they got their tattoos. Assume that six adults who regret getting tattoos are randomly selected, and find the indicated probability. Complete parts (a) through (d) below. a. Find the probability that none of the selected adults say that they were too young to get tattoos. 0.0520 (Round to four decimal places as needed.) Clear all Final check Feb 7 12:47 US Oarrow_forwardhow could the bar graph have been organized differently to make it easier to compare opinion changes within political partiesarrow_forward
- 30. An individual who has automobile insurance from a certain company is randomly selected. Let Y be the num- ber of moving violations for which the individual was cited during the last 3 years. The pmf of Y isy | 1 2 4 8 16p(y) | .05 .10 .35 .40 .10 a.Compute E(Y).b. Suppose an individual with Y violations incurs a surcharge of $100Y^2. Calculate the expected amount of the surcharge.arrow_forward24. An insurance company offers its policyholders a num- ber of different premium payment options. For a ran- domly selected policyholder, let X = the number of months between successive payments. The cdf of X is as follows: F(x)=0.00 : x < 10.30 : 1≤x<30.40 : 3≤ x < 40.45 : 4≤ x <60.60 : 6≤ x < 121.00 : 12≤ x a. What is the pmf of X?b. Using just the cdf, compute P(3≤ X ≤6) and P(4≤ X).arrow_forward59. At a certain gas station, 40% of the customers use regular gas (A1), 35% use plus gas (A2), and 25% use premium (A3). Of those customers using regular gas, only 30% fill their tanks (event B). Of those customers using plus, 60% fill their tanks, whereas of those using premium, 50% fill their tanks.a. What is the probability that the next customer will request plus gas and fill the tank (A2 B)?b. What is the probability that the next customer fills the tank?c. If the next customer fills the tank, what is the probability that regular gas is requested? Plus? Premium?arrow_forward
- 38. Possible values of X, the number of components in a system submitted for repair that must be replaced, are 1, 2, 3, and 4 with corresponding probabilities .15, .35, .35, and .15, respectively. a. Calculate E(X) and then E(5 - X).b. Would the repair facility be better off charging a flat fee of $75 or else the amount $[150/(5 - X)]? [Note: It is not generally true that E(c/Y) = c/E(Y).]arrow_forward74. The proportions of blood phenotypes in the U.S. popula- tion are as follows:A B AB O .40 .11 .04 .45 Assuming that the phenotypes of two randomly selected individuals are independent of one another, what is the probability that both phenotypes are O? What is the probability that the phenotypes of two randomly selected individuals match?arrow_forward53. A certain shop repairs both audio and video compo- nents. Let A denote the event that the next component brought in for repair is an audio component, and let B be the event that the next component is a compact disc player (so the event B is contained in A). Suppose that P(A) = .6 and P(B) = .05. What is P(BA)?arrow_forward
 Holt Mcdougal Larson Pre-algebra: Student Edition...AlgebraISBN:9780547587776Author:HOLT MCDOUGALPublisher:HOLT MCDOUGAL
 Big Ideas Math A Bridge To Success Algebra 1: Stu...AlgebraISBN:9781680331141Author:HOUGHTON MIFFLIN HARCOURTPublisher:Houghton Mifflin Harcourt
 Glencoe Algebra 1, Student Edition, 9780079039897...AlgebraISBN:9780079039897Author:CarterPublisher:McGraw Hill
 College Algebra (MindTap Course List)AlgebraISBN:9781305652231Author:R. David Gustafson, Jeff HughesPublisher:Cengage Learning
