Videos
To review:
An experimental approach for testing the hypothesis generated in question 1 and its results.
Given:
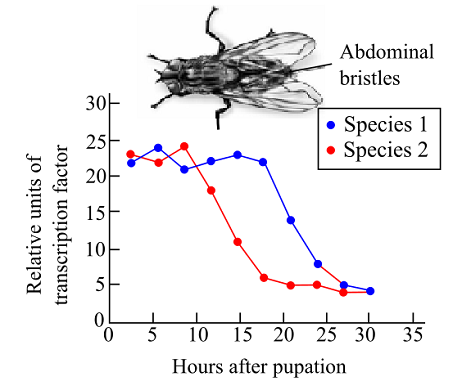
Figure 1 shows the gene expression pattern for both species 1 and 2 over the course of time.
Introduction:
Transcription factors are the proteins involved in the process of transcribing the DNA (deoxyribonucleic acid) molecules into RNA (ribonucleic acid). These factors can repress or activate transcription to regulate expression of a gene within a cell of an organism. Based on the observations from Figure 1, a hypothesis was generated in question 1 and it was stated that the differential timing of expression of transcription factor causes the morphological difference between species 1 and 2. A longer period of high transcription factor’s expression, in species 1 specifically leads to longer abdominal bristles in that species.
Want to see the full answer?
Check out a sample textbook solution
Chapter 19 Solutions
LIFE: THE SCIENCE OF BIOLOGY


- You implant an FGF10-coated bead into the anterior flank of a chicken embryo, directly below the level of the wing bud. What is the phenotype of the resulting ectopic limb? Briefly describe the expected expression domains of 1) Shh, 2) Tbx4, and 3) Tbx5 in the resulting ectopic limb bud.arrow_forwardDesign a grafting experiment to determine if limb mesoderm determines forelimb / hindlimb identity. Include the experiment, a control, and an interpretation in your answer.arrow_forwardThe Snapdragon is a popular garden flower that comes in a variety of colours, including red, yellow, and orange. The genotypes and associated phenotypes for some of these flowers are as follows: aabb: yellow AABB, AABb, AaBb, and AaBB: red AAbb and Aabb: orange aaBB: yellow aaBb: ? Based on this information, what would the phenotype of a Snapdragon with the genotype aaBb be and why? Question 21 options: orange because A is epistatic to B yellow because A is epistatic to B red because B is epistatic to A orange because B is epistatic to A red because A is epistatic to B yellow because B is epistatic to Aarrow_forward
- A sample of blood was taken from the above individual and prepared for haemoglobin analysis. However, when water was added the cells did not lyse and looked normal in size and shape. The technician suspected that they had may have made an error in the protocol – what is the most likely explanation? The cell membranes are more resistant than normal. An isotonic solution had been added instead of water. A solution of 0.1 M NaCl had been added instead of water. Not enough water had been added to the red blood cell pellet. The man had sickle-cell anaemia.arrow_forwardA sample of blood was taken from the above individual and prepared for haemoglobin analysis. However, when water was added the cells did not lyse and looked normal in size and shape. The technician suspected that they had may have made an error in the protocol – what is the most likely explanation? The cell membranes are more resistant than normal. An isotonic solution had been added instead of water. A solution of 0.1 M NaCl had been added instead of water. Not enough water had been added to the red blood cell pellet. The man had sickle-cell anaemia.arrow_forwardWith reference to their absorption spectra of the oxy haemoglobin intact line) and deoxyhemoglobin (broken line) shown in Figure 2 below, how would you best explain the reason why there are differences in the major peaks of the spectra? Figure 2. SPECTRA OF OXYGENATED AND DEOXYGENATED HAEMOGLOBIN OBTAINED WITH THE RECORDING SPECTROPHOTOMETER 1.4 Abs < 0.8 06 0.4 400 420 440 460 480 500 520 540 560 580 600 nm 1. The difference in the spectra is due to a pH change in the deoxy-haemoglobin due to uptake of CO2- 2. There is more oxygen-carrying plasma in the oxy-haemoglobin sample. 3. The change in Mr due to oxygen binding causes the oxy haemoglobin to have a higher absorbance peak. 4. Oxy-haemoglobin is contaminated by carbaminohemoglobin, and therefore has a higher absorbance peak 5. Oxy-haemoglobin absorbs more light of blue wavelengths and less of red wavelengths than deoxy-haemoglobinarrow_forward
- With reference to their absorption spectra of the oxy haemoglobin intact line) and deoxyhemoglobin (broken line) shown in Figure 2 below, how would you best explain the reason why there are differences in the major peaks of the spectra? Figure 2. SPECTRA OF OXYGENATED AND DEOXYGENATED HAEMOGLOBIN OBTAINED WITH THE RECORDING SPECTROPHOTOMETER 1.4 Abs < 0.8 06 0.4 400 420 440 460 480 500 520 540 560 580 600 nm 1. The difference in the spectra is due to a pH change in the deoxy-haemoglobin due to uptake of CO2- 2. There is more oxygen-carrying plasma in the oxy-haemoglobin sample. 3. The change in Mr due to oxygen binding causes the oxy haemoglobin to have a higher absorbance peak. 4. Oxy-haemoglobin is contaminated by carbaminohemoglobin, and therefore has a higher absorbance peak 5. Oxy-haemoglobin absorbs more light of blue wavelengths and less of red wavelengths than deoxy-haemoglobinarrow_forwardWhich ONE of the following is FALSE regarding haemoglobin? It has two alpha subunits and two beta subunits. The subunits are joined by disulphide bonds. Each subunit covalently binds a haem group. Conformational change in one subunit can be transmitted to another. There are many variant ("mutant") forms of haemoglobin that are not harmful.arrow_forwardWhich ONE of the following is FALSE regarding haemoglobin? It has two alpha subunits and two beta subunits. The subunits are joined by disulphide bonds. Each subunit covalently binds a haem group. Conformational change in one subunit can be transmitted to another. There are many variant ("mutant") forms of haemoglobin that are not harmful.arrow_forward
- During a routine medical check up of a healthy man it was found that his haematocrit value was highly unusual – value of 60%. What one of the options below is the most likely reason? He will have a diet high in iron. He is likely to be suffering from anaemia. He lives at high altitude. He has recently recovered from an accident where he lost a lot of blood. He has a very large body size.arrow_forwardExplain what age of culture is most likely to produce an endospore?arrow_forwardExplain why hot temperatures greater than 45 degrees celsius would not initiate the sporulation process in endospores?arrow_forward
 Human Heredity: Principles and Issues (MindTap Co...BiologyISBN:9781305251052Author:Michael CummingsPublisher:Cengage Learning
- Case Studies In Health Information ManagementBiologyISBN:9781337676908Author:SCHNERINGPublisher:Cengage
 Human Biology (MindTap Course List)BiologyISBN:9781305112100Author:Cecie Starr, Beverly McMillanPublisher:Cengage Learning
 Biology 2eBiologyISBN:9781947172517Author:Matthew Douglas, Jung Choi, Mary Ann ClarkPublisher:OpenStax