
a)
To Analyze: The effect, on the exchange rate between yen and dollar when Japan opens domestic market to more foreign competition, by using supply-and-
a)
Answer to Problem 1TY
The exchange rate for American dollars increases when Japan opens domestic market to more number of foreign countries.
Explanation of Solution
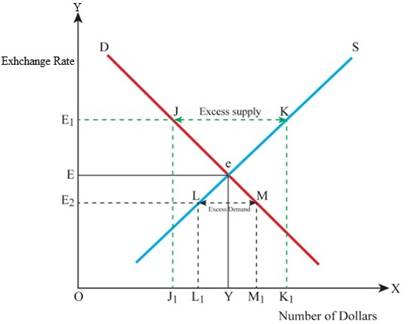
The below mentioned diagram shows the exchange rate being determined based on the supply of dollars in the foreign exchange market.

In the above mentioned graph the
At the point e, the demand for dollar becomes equal to the supply of dollars, and this point is considered as the equilibrium point. For the dollar at Y, the exchange rate will be E. The supply of dollar is K, for the demand for dollar j, and the excess of dollar supply will cause decrease in the value of dollar, subsequent decrease in the exchange rate from
When Japan opens its domestic market to foreign countries, the import also increases, causing an increase in the demand for American dollars in the foreign exchange market. The value of dollar will be appreciated with increase in its demand, thus increasing the exchange rate.
b)
To Analyze: The effect, on the exchange rate between yen and dollar when the value in Tokyo stock market is believed to be falling, by the investors using the supply-and-demand diagrams.
b)
Answer to Problem 1TY
As there is an outflow of funds in order to invest in American Stock Exchange, there will be an increase in the exchange rate also.
Explanation of Solution
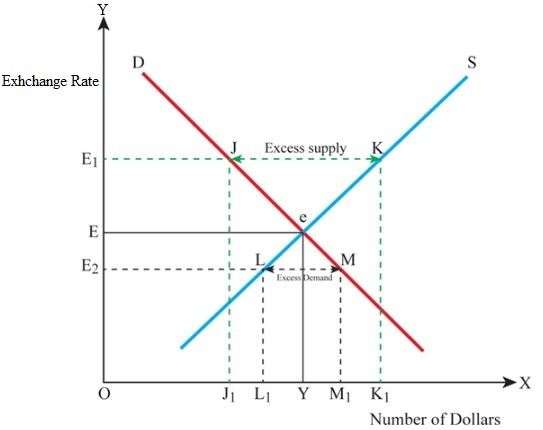
The below mentioned diagram shows the exchange rate being determined based on the supply of dollars in the foreign exchange market.

In the above mentioned graph the
At the point e, the demand for dollar becomes equal to the supply of dollars, and this point is considered as the equilibrium point. For the dollar at Y, the exchange rate will be E. The supply of dollar is K, for the demand for dollar j, and the excess of dollar supply will cause a decrease in the value of dollar, subsequently resulting in a decrease in the exchange rate from
When the investors feel that the value in Tokyo Stock Market is falling, they will start diverting their investments in to American Stock Market. Thus, there will be a capital outflow from Japan to America, which in turn will increase the demand for American dollars in the foreign exchange and the value of dollar also increases. Subsequently there will be an increase in the exchange rate.
c)
To Analyze: The effect, on the exchange rate between yen and dollar when the interest rates are cut by FR in United States, by using supply-and-demand diagrams.
c)
Answer to Problem 1TY
When there is a cut in interest rates by FR, the value of yen increases in foreign exchange and the exchange rate of dollar decreases.
Explanation of Solution
The below mentioned diagram shows the exchange rate being determined based on the supply of dollars in the foreign exchange market.

In the above mentioned graph the
At the point e, the demand for dollar becomes equal to the supply of dollars, and this point is considered as the equilibrium point. For the dollar at Y, the exchange rate will be E. The supply of dollar is K, for the demand for dollar j, and the excess of dollar supply will cause decrease in the value of dollar, subsequently causing a decrease in the exchange rate from
As there is a cut in interest rates in FR, investors will be attracted to higher interest rates being offered by Japan and starts diverting their investments to Japan. Thus the demand for Japanese Yen becomes more in the foreign exchange market, increasing the value of yen against that of dollar, thus decreasing the exchange rate of dollar.
d)
To Analyze: The effect, on the exchange rate between yen and dollar, when huge amounts of foreign aid is given to Israel and her Arab neighbors, by the United States, in order to settle problems in Middle East, by using supply-and-demand diagrams.
d)
Answer to Problem 1TY
When United States gives huge sum of money for settling problems in Middle East, the value of dollar decreases and hence its exchange rate also decreases.
Explanation of Solution
The below mentioned diagram shows the exchange rate being determined based on the supply of dollars in the foreign exchange market.
In the above mentioned graph the
At the point e, the demand for dollar becomes equal to the supply of dollars, and this point is considered as the equilibrium point. For the dollar at Y, the exchange rate will be E. The supply of dollar is K, for the demand for dollar j, and the excess of dollar supply will cause a decrease in the value of dollar, subsequently resulting in a decrease in the exchange rate from
When huge amounts of aid is given to Israel and her neighbors to settle problems in Middle East, there will be an increase in supply of dollars in to the foreign exchange market, which in turn decreases the value of dollar thus decreasing its exchange rate.
e)
To Analyze: The effect, on the exchange rate between yen and dollar, when there is recession in United States and boom in Japan, by using supply-and-demand diagrams.
e)
Answer to Problem 1TY
When there is recession in United States, the value of dollar increases thereby increasing its exchange rate.
Explanation of Solution
The below mentioned diagram shows the exchange rate being determined based on the supply of dollars in the foreign exchange market.

In the above mentioned graph the
At the point e, the demand for dollar becomes equal to the supply of dollars, and this point is considered as the equilibrium point. For the dollar at Y, the exchange rate will be E. The supply of dollar is K, for the demand for dollar j, and the excess of dollar supply will cause a decrease in the value of dollar, subsequently causing a decrease in the exchange rate from
When there is recession in United States, its imports decreases and export increases, and when there is a boom in Japan, its imports increases and export decreases. Thus the demand for Yen by United States decreases, while the demand for dollar by Japan increases, increasing the value of dollar, and thereby increase in its exchange rate.
f)
To Analyze: The effect, on the exchange rate between yen and dollar, when inflation in United States exceeds than that in Japan, by using supply-and-demand diagrams.
f)
Answer to Problem 1TY
When there is inflation in the United States more than that in Japan, then the value of dollar decreases, thereby decreasing its exchange rate.
Explanation of Solution
The below mentioned diagram shows the exchange rate being determined based on the supply of dollars in the foreign exchange market.
In the above mentioned graph the
At the point e, the demand for dollar becomes equal to the supply of dollars, and this point is considered as the equilibrium point. For the dollar at Y, the exchange rate will be E. The supply of dollar is K, for the demand for dollar j, and the excess of dollar supply will cause decrease in the value of dollar, subsequently resulting in decrease in the exchange rate from
When there is inflation in United States than that of Japan, the imports in United States increases, which increases the supply of dollars in foreign exchange market. This decreases the value of dollar, thereby decreasing its exchange rate.
Want to see more full solutions like this?

- 2. What is the payoff from a long futures position where you are obligated to buy at the contract price? What is the payoff from a short futures position where you are obligated to sell at the contract price?? Draw the payoff diagram for each position. Payoff from Futures Contract F=$50.85 S1 Long $100 $95 $90 $85 $80 $75 $70 $65 $60 $55 $50.85 $50 $45 $40 $35 $30 $25 Shortarrow_forward3. Consider a call on the same underlier (Cisco). The strike is $50.85, which is the forward price. The owner of the call has the choice or option to buy at the strike. They get to see the market price S1 before they decide. We assume they are rational. What is the payoff from owning (also known as being long) the call? What is the payoff from selling (also known as being short) the call? Payoff from Call with Strike of k=$50.85 S1 Long $100 $95 $90 $85 $80 $75 $70 $65 $60 $55 $50.85 $50 $45 $40 $35 $30 $25 Shortarrow_forward4. Consider a put on the same underlier (Cisco). The strike is $50.85, which is the forward price. The owner of the call has the choice or option to buy at the strike. They get to see the market price S1 before they decide. We assume they are rational. What is the payoff from owning (also known as being long) the put? What is the payoff from selling (also known as being short) the put? Payoff from Put with Strike of k=$50.85 S1 Long $100 $95 $90 $85 $80 $75 $70 $65 $60 $55 $50.85 $50 $45 $40 $35 $30 $25 Shortarrow_forward
- The following table provides information on two technology companies, IBM and Cisco. Use the data to answer the following questions. Company IBM Cisco Systems Stock Price Dividend (trailing 12 months) $150.00 $50.00 $7.00 Dividend (next 12 months) $7.35 Dividend Growth 5.0% $2.00 $2.15 7.5% 1. You buy a futures contract instead of purchasing Cisco stock at $50. What is the one-year futures price, assuming the risk-free interest rate is 6%? Remember to adjust the futures price for the dividend of $2.15.arrow_forward5. Consider a one-year European-style call option on Cisco stock. The strike is $50.85, which is the forward price. The risk-free interest rate is 6%. Assume the stock price either doubles or halves each period. The price movement corresponds to u = 2 and d = ½ = 1/u. S1 = $100 Call payoff= SO = $50 S1 = $25 Call payoff= What is the call payoff for $1 = $100? What is the call payoff for S1 = $25?arrow_forwardMC The diagram shows a pharmaceutical firm's demand curve and marginal cost curve for a new heart medication for which the firm holds a 20-year patent on its production. Assume this pharmaceutical firm charges a single price for its drug. At its profit-maximizing level of output, it will generate a total profit represented by OA. areas J+K. B. areas F+I+H+G+J+K OC. areas E+F+I+H+G. D. - it is not possible to determine with the informatio OE. the sum of areas A through K. (...) Po P1 Price F P2 E H 0 G B Q MR D ōarrow_forward
- Price Quantity $26 0 The marketing department of $24 20,000 Johnny Rockabilly's record company $22 40,000 has determined that the demand for his $20 60,000 latest CD is given in the table at right. $18 80,000 $16 100,000 $14 120,000 The record company's costs consist of a $240,000 fixed cost of recording the CD, an $8 per CD variable cost of producing and distributing the CD, plus the cost of paying Johnny for his creative talent. The company is considering two plans for paying Johnny. Plan 1: Johnny receives a zero fixed recording fee and a $4 per CD royalty for each CD that is sold. Plan 2: Johnny receives a $400,000 fixed recording fee and zero royalty per CD sold. Under either plan, the record company will choose the price of Johnny's CD so as to maximize its (the record company's) profit. The record company's profit is the revenues minus costs, where the costs include the costs of production, distribution, and the payment made to Johnny. Johnny's payment will be be under plan 2 as…arrow_forwardWhich of the following is the best example of perfect price discrimination? A. Universities give entry scholarships to poorer students. B. Students pay lower prices at the local theatre. ○ C. A hotel charges for its rooms according to the number of days left before the check-in date. ○ D. People who collect the mail coupons get discounts at the local food store. ○ E. An airline offers a discount to students.arrow_forwardConsider the figure at the right. The profit of the single-price monopolist OA. is shown by area D+H+I+F+A. B. is shown by area A+I+F. OC. is shown by area D + H. ○ D. is zero. ○ E. cannot be calculated or shown with just the information given in the graph. (C) Price ($) B C D H FIG шо E MC ATC A MR D = AR Quantityarrow_forward
- Consider the figure. A perfectly price-discriminating monopolist will produce ○ A. 162 units and charge a price equal to $69. ○ B. 356 units and charge a price equal to $52 for the last unit sold only. OC. 162 units and charge a price equal to $52. OD. 356 units and charge a price equal to the perfectly competitive price. Dollars per Unit $69 $52 MR 162 356 Output MC Darrow_forwardThe figure at right shows the demand line, marginal revenue line, and cost curves for a single-price monopolist. Now suppose the monopolist is able to charge a different price on each different unit sold. The profit-maximizing quantity for the monopolist is (Round your response to the nearest whole number.) The price charged for the last unit sold by this monopolist is $ (Round your response to the nearest dollar.) Price ($) 250 225- 200- The monopolist's profit is $ the nearest dollar.) (Round your response to MC 175- 150 ATC 125- 100- 75- 50- 25- 0- °- 0 20 40 60 MR 80 100 120 140 160 180 200 Quantityarrow_forwardThe diagram shows a pharmaceutical firm's demand curve and marginal cost curve for a new heart medication for which the firm holds a 20-year patent on its production. At its profit-maximizing level of output, it will generate a deadweight loss to society represented by what? A. There is no deadweight loss generated. B. Area H+I+J+K OC. Area H+I D. Area D + E ◇ E. It is not possible to determine with the information provided. (...) 0 Price 0 m H B GI A MR MC D Outparrow_forward

 Macroeconomics: Private and Public Choice (MindTa...EconomicsISBN:9781305506756Author:James D. Gwartney, Richard L. Stroup, Russell S. Sobel, David A. MacphersonPublisher:Cengage Learning
 Economics: Private and Public Choice (MindTap Cou...EconomicsISBN:9781305506725Author:James D. Gwartney, Richard L. Stroup, Russell S. Sobel, David A. MacphersonPublisher:Cengage Learning
 Exploring EconomicsEconomicsISBN:9781544336329Author:Robert L. SextonPublisher:SAGE Publications, Inc
