Videos
To review:
The results and formulate a hypothesis for the role of a transcription factor in the two species. Also, assess whether it is an example of heterometry, heterotropy, or heterochrony.
Introduction:
Transcription factors are the proteins involved in the process of transcribing the DNA (deoxyribonucleic acid) molecules into RNA (ribonucleic acid). These factors can repress or activate transcription to regulate expression of a gene within a cell of an organism.
Heterometry is referred to the change in the amount of gene expression during the developmental stages of an organism. Heterotropy is termed as the evolutionary change in the spatial pattern of development. Heterochrony is defined as the change in gene expression timings and developmental rates of an organism. The figure shows the gene expression pattern for both species 1 and 2 over the course of time.
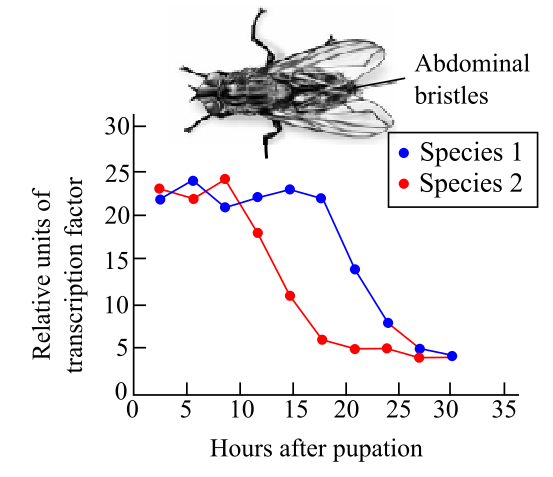
Figure: Change in relative units of a transcription factor with time.
Explanation of Solution
It can be clearly observed from the above figure that the two species are relatively different in terms of the duration of time taken for a transcription factor to remain high. In species 1, the duration of gene expression remains longer in comparison to the expression of a transcription factor in species 2. Thus, it is an example of heterochrony due to the differences in their timing of transcription factor’s expression.
Thus, it can be hypothetically stated that the differential timing of expression of the transcription factor causes the morphological difference between species 1 and 2. A longer period of high transcription factor’s expression in species 1 specifically leads to longer abdominal bristles in that species.
Thus, it can be concluded that the species 1 have a longer time of expression of a transcription factor as compared to species 2 and this an example of heterochrony. The morphological differences occur between the two species due to the difference in the timing of expression of the transcription factors.
Want to see more full solutions like this?
Chapter 19 Solutions
LIFE:SCIENCE OF BIOL.(LL) >CUSTOM<


- H gene assorts independently from the I gene. Both on autosomes. One man and one woman, both of HhIAIB genotype. Determine the blood type of progeny and fractions out of 16arrow_forwardAlleles at the P locus control seed color. Plants which are pp have white seeds, white flowers and no pigment in vegetative parts. Plants which are P_ have black seeds, purple flowers and may have varying degrees of pigment on stems and leaves. Seed color can be assessed, visually, based on if the seed is white or not white A gene for mold resistance has been reported and we want to determine its inheritance and whether it is linked to P. For the purposes of this exercise, we will assume that resistance is controlled by a single locus M, and M_ plants are resistant and mm plants are susceptible. Resistance can be measured, under greenhouse conditions, 2 weeks after planting, by injecting each seedling with a spore suspension. After two weeks, the seedlings can be rated as resistant or susceptible, based on whether or not tissue is actively sporulating. For this exercise we will use seed and data from the F10 generation of a recombinant inbred population produced using single seed…arrow_forwardLinkage in common bean Alleles at the P locus control seed color. Plants which are pp have white seeds, white flowers and no pigment in vegetative parts. Plants which are P_ have black seeds, purple flowers and may have varying degrees of pigment on stems and leaves. Seed color can be assessed, visually, based on if the seed is white or not white A gene for mold resistance has been reported and we want to determine its inheritance and whether it is linked to P. For the purposes of this exercise, we will assume that resistance is controlled by a single locus M, and M_ plants are resistant and mm plants are susceptible. Resistance can be measured, under greenhouse conditions, 2 weeks after planting, by injecting each seedling with a spore suspension. After two weeks, the seedlings can be rated as resistant or susceptible, based on whether or not tissue is actively sporulating. For this exercise we will use seed and data from the F10 generation of a recombinant inbred population…arrow_forward
- Alleles at the P locus control seed color. Plants which are pp have white seeds, white flowers and no pigment in vegetative parts. Plants which are P_ have black seeds, purple flowers and may have varying degrees of pigment on stems and leaves. Seed color can be assessed, visually, based on if the seed is white or not white A gene for mold resistance has been reported and we want to determine its inheritance and whether it is linked to P. For the purposes of this exercise, we will assume that resistance is controlled by a single locus M, and M_ plants are resistant and mm plants are susceptible. Resistance can be measured, under greenhouse conditions, 2 weeks after planting, by injecting each seedling with a spore suspension. After two weeks, the seedlings can be rated as resistant or susceptible, based on whether or not tissue is actively sporulating. For this exercise we will use seed and data from the F10 generation of a recombinant inbred population produced using single seed…arrow_forwardcan you help? I think its B but not surearrow_forwardSkip to main content close Homework Help is Here – Start Your Trial Now! arrow_forward search SEARCH ASK Human Anatomy & Physiology (11th Edition)BUY Human Anatomy & Physiology (11th Edition) 11th Edition ISBN: 9780134580999 Author: Elaine N. Marieb, Katja N. Hoehn Publisher: PEARSON 1 The Human Body: An Orientation expand_moreChapter 1 : The Human Body: An Orientation Chapter Questions expand_moreSection: Chapter Questions Problem 1RQ: The correct sequence of levels forming the structural hierarchy is A. (a) organ, organ system,... format_list_bulletedProblem 1RQ: The correct sequence of levels forming the structural hierarchy is A. (a) organ, organ system,... See similar textbooks Bartleby Related Questions Icon Related questions Bartleby Expand Icon bartleby Concept explainers bartleby Question Draw a replication bubble with two replication forks.blue lines are DNA single strands and red lines are RNA single strands.indicate all 3' and 5’ ends on all DNA single…arrow_forward
- Provide an answerarrow_forwardQuestion 4 1 pts Which of the following would be most helpful for demonstrating alternative splicing for a new organism? ○ its proteome and its transcriptome only its transcriptome only its genome its proteome and its genomearrow_forwardIf the metabolic scenario stated with 100 mM of a sucrose solution, how much ATP would be made then during fermentation?arrow_forward
- What is agricuarrow_forwardWhen using the concept of "a calorie in is equal to a calorie out" how important is the quality of the calories?arrow_forwardWhat did the Cre-lox system used in the Kikuchi et al. 2010 heart regeneration experiment allow researchers to investigate? What was the purpose of the cmlc2 promoter? What is CreER and why was it used in this experiment? If constitutively active Cre was driven by the cmlc2 promoter, rather than an inducible CreER system, what color would you expect new cardiomyocytes in the regenerated area to be no matter what? Why?arrow_forward
 Biology (MindTap Course List)BiologyISBN:9781337392938Author:Eldra Solomon, Charles Martin, Diana W. Martin, Linda R. BergPublisher:Cengage Learning
 Biology: The Dynamic Science (MindTap Course List)BiologyISBN:9781305389892Author:Peter J. Russell, Paul E. Hertz, Beverly McMillanPublisher:Cengage Learning
 Biology 2eBiologyISBN:9781947172517Author:Matthew Douglas, Jung Choi, Mary Ann ClarkPublisher:OpenStax
 Human Heredity: Principles and Issues (MindTap Co...BiologyISBN:9781305251052Author:Michael CummingsPublisher:Cengage Learning