
(a)
To explain:
The effect of an increase in government purchase in the short run on the given two diagrams.
Answer to Problem 1P
The effect of an increase in government purchase is shown on the diagrams below:
Explanation of Solution
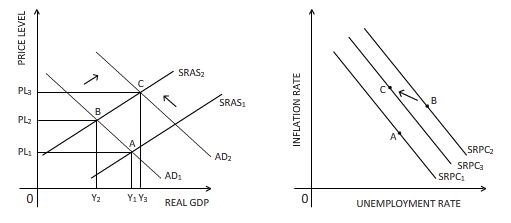
Government purchase is a part of aggregate demand. When there is an increase in the purchase by the government, it boosts the aggregate demand of the economy. This is reflected in the rightward shift of the aggregate demand curve from AD1 to AD2 in the above diagram. This results in a new equilibrium point C in the diagram where both real
Government purchase:
The goods and services bought by the government to undertake infrastructural developments and other developmental activities is referred as government purchase.
(b)
To explain:
The effect of reduced growth rate of money supply in the short run on the given two diagrams.
Answer to Problem 1P
The effect of decrease in growth rate of money supply is shown on the diagrams below:
Explanation of Solution
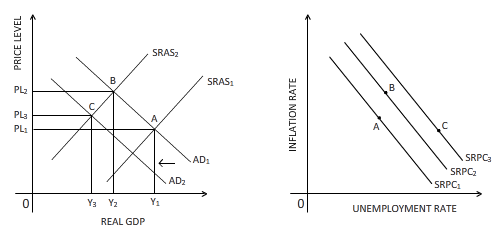
A reduction in the growth rate of money supply affects the aggregate demand negatively through the real balance effect. This leads to a leftward shift of the aggregate demand curve from AD1 to AD2. The new equilibrium point is established at point C, where both real GDP and price level are lower than that of the equilibrium point at B. Due to fall in real GDP, there will be rise in unemployment, and hence the SRPC line shifts rightward from SRPC2 to SRPC3. The new equilibrium point C is shown on the SRPC3 in the right-hand side diagram.
Money supply:
The amount of money in the form of currency and other financial liquid instruments supplied in an economy over a specific time period is referred as money supply.
(c)
To explain:
The effect of an expected higher inflation in the short run on the given two diagrams.
Answer to Problem 1P
The effect of an expected higher inflation is shown on the diagrams below:

Explanation of Solution
If people expect that higher inflation is approaching, they will increase their consumption expenditure to ward off the high inflation. Therefore, the aggregate demand will rise in the short run. This is reflected in the rightward shift of the aggregate demand curve from AD1 to AD2 in the above diagram. This results in a new equilibrium point C in the diagram where both real GDP and price level are higher than that of point B. On the right-hand side diagram, the SRPC line shifts from SRPC2 to SRPC3 because as real GDP grows at each level of inflation rate, unemployment falls. The new equilibrium point C is marked on SRPC3 line.
Inflation rate:
The rate at which the price level of an economy rises is termed as the rate of inflation. An increased inflation rate decreases the
(d)
To explain:
The effect of a favorable supply shock on the given two diagrams.
Answer to Problem 1P
The effect of supply shock is shown on the diagrams below:
Explanation of Solution
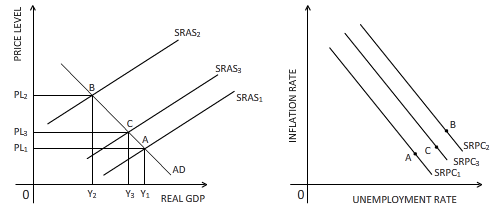
A favorable supply shock will push the supply of the economy upward, causing the
Supply shock:
An event which leads to a sudden rise or fall in the supply of goods and services is referred as supply shock.
Want to see more full solutions like this?

- Price P 1. Explain the distinction between outputs and outcomes in social service delivery 2. Discuss the Rawlsian theory of justice and briefly comment on its relevance to the political economy of South Africa. [2] [7] 3. Redistributive expenditure can take the form of direct cash transfers (grants) and/or in- kind subsidies. With references to the graphs below, discuss the merits of these two transfer types in the presence and absence of a positive externality. [6] 9 Quantity (a) P, MC, MB MSB MPB+MEB MPB P-MC MEB Quantity (6) MCarrow_forwardDon't use ai to answer I will report you answerarrow_forwardIf 17 Ps are needed and no on-hand inventory exists fot any of thr items, how many Cs will be needed?arrow_forward
- Exercise 5Consider the demand and supply functions for the notebooks market.QD=10,000−100pQS=900pa. Make a table with the corresponding supply and demand schedule.b. Draw the corresponding graph.c. Is it possible to find the price and quantity of equilibrium with the graph method? d. Find the price and quantity of equilibrium by solving the system of equations.arrow_forward1. Consider the market supply curve which passes through the intercept and from which the marketequilibrium data is known, this is, the price and quantity of equilibrium PE=50 and QE=2000.a. Considering those two points, find the equation of the supply. b. Draw a graph for this equation. 2. Considering the previous supply line, determine if the following demand function corresponds to themarket demand equilibrium stated above. QD=.3000-2p.arrow_forwardSupply and demand functions show different relationship between the price and quantities suppliedand demanded. Explain the reason for that relation and provide one reference with your answer.arrow_forward
- 13:53 APP 簸洛瞭對照 Vo 56 5G 48% 48% atheva.cc/index/index/index.html The Most Trusted, Secure, Fast, Reliable Cryptocurrency Exchange Get started with the easiest and most secure platform to buy, sell, trade, and earn Cryptocurrency Balance:0.00 Recharge Withdraw Message About us BTC/USDT ETH/USDT EOS/USDT 83241.12 1841.50 83241.12 +1.00% +0.08% +1.00% Operating norms Symbol Latest price 24hFluctuation B BTC/USDT 83241.12 +1.00% ETH/USDT 1841.50 +0.08% B BTC/USD illı 83241.12 +1.00% Home Markets Trade Record Mine О <arrow_forwardThe production function of a firm is described by the following equation Q=10,000L-3L2 where Lstands for the units of labour.a) Draw a graph for this equation. Use the quantity produced in the y-axis, and the units of labour inthe x-axis. b) What is the maximum production level? c) How many units of labour are needed at that point?arrow_forwardDon't use ai to answer I will report you answerarrow_forward

 Economics (MindTap Course List)EconomicsISBN:9781337617383Author:Roger A. ArnoldPublisher:Cengage Learning

 Exploring EconomicsEconomicsISBN:9781544336329Author:Robert L. SextonPublisher:SAGE Publications, Inc
 Principles of Economics (MindTap Course List)EconomicsISBN:9781305585126Author:N. Gregory MankiwPublisher:Cengage Learning