Concept explainers
Videos
1.
Cost-Volume-Profit Analysis: It is a method followed to analyze the relationship between the sales, costs, and the related profit or loss at various levels of units sold. In other words, it shows the effect of the changes in the cost and the sales volume on the operating income of the company.
To prepare: an estimated income statement for 2016.
1.
Answer to Problem 19.6BPR
Prepare an estimated income statement for 2016.
| Company B | |||
| Estimated Income Statement | |||
| For the year ended December 31, 2016 | |||
| Particulars | Amount ($) | Amount ($) | Amount ($) |
| Sales (1) | 2,880,000 | ||
| Less: Cost of Goods sold: | |||
| Direct Materials (2) | 600,000 | ||
| Direct Labor (3) | 360,000 | ||
| Factory Overhead (4) | 422,000 | ||
| Cost of Goods Sold | (1,382,000) | ||
| Gross Profit | 1,498,000 | ||
| Less: Expenses: | |||
| Selling expenses: | |||
| Sales salaries and commissions (5) | 388,000 | ||
| Advertising | 116,000 | ||
| Travel | 4,000 | ||
| Miscellaneous selling expense (6) | 14,300 | ||
| Total selling expenses | 522,300 | ||
| Administrative expenses: | |||
| Office and Officers’ salaries | 325,000 | ||
| Supplies (7) | 54,000 | ||
| Miscellaneous administrative expenses (8) | 20,700 | ||
| Total administrative expenses | 399,700 | ||
| Total expenses | (922,000) | ||
| Income from operations | 576,000 | ||
Table (1)
Explanation of Solution
Working notes:
Determine sales.
Number of units to be sold =12,000 units
Selling price per unit =$240 per unit
Determine the cost of direct materials.
Number of units to be sold =12,000 units
Direct Materials cost per unit =$50 per unit
Determine the cost of direct labor.
Number of units to be sold =12,000 units
Direct labor cost per unit =$30 per unit
Determine the cost of factory overhead.
Factory overhead-Fixed =$350,000
Number of units to be sold =12,000 units
Factory overhead-Variable cost per unit =$6 per unit
Determine the sales salaries and commissions.
Sales salaries and commissions-Fixed =$340,000
Number of units to be sold =12,000 units
Sales salaries and commissions-Variable cost per unit =$4 per unit
Determine the miscellaneous selling expense.
Miscellaneous selling expense-Fixed =$2,300
Number of units to be sold =12,000 units
Miscellaneous selling expense-Variable cost per unit =$1 per unit
Determine the supplies.
Supplies-Fixed =$6,000
Number of units to be sold =12,000 units
Supplies-Variable cost per unit =$4 per unit
Determine the miscellaneous administrative expense.
Miscellaneous administrative expense-Fixed =$8,700
Number of units to be sold =12,000 units
Miscellaneous administrative expense-Variable cost per unit =$1 per unit
2.
the expected contribution margin ratio.
2.
Explanation of Solution
Determine the expected contribution margin ratio.
Sales =$2,880,000 (1)
Variable cost =$1,152,000 (9)
Working note:
Determine the variable cost.
Number of units to be sold =12,000 units
Variable cost per unit =$96 per unit
Therefore, the expected contribution margin ratio is 60%.
3.
the break-even sales in units and dollars.
3.
Explanation of Solution
Determine the break-even sales in units.
Fixed cost =$1,152,000
Contribution margin per unit =$144 per unit (10)
Working note:
Compute the contribution margin per unit.
Selling price per unit =$240 per unit
Variable cost per unit =$96 per unit
Determine the break-even sales in dollars.
Fixed cost =$1,152,000
Contribution margin ratio =60% (refer Part 2)
Therefore, the break-even sales in units is 8,000 units and dollars is $1,920,000.
4.
To construct: a cost-volume-profit chart indicating the break-even sales.
4.
Answer to Problem 19.6BPR
Construct a cost-volume-profit chart indicating the break-even sales.
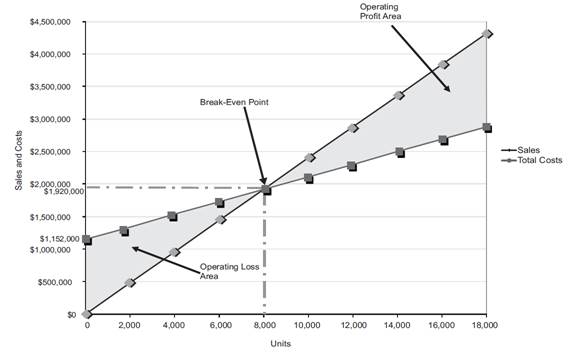
Figure (1)
Explanation of Solution
The volume in units of sales is shown on the horizontal axis. The maximum relevant range is 18,000 units. The sales and the total costs (fixed cost and variable cost) in dollars is shown on the vertical axis. The maximum relevant range of sales and total costs is $4,500,000.
The total sales line is drawn right upward by connecting the first point at $0 to the second point at $4,320,000
The total cost line is drawn right upward by connecting the first point at $1,152,000 (fixed cost) on the vertical axis to the second point at
The break-even point is the intersection point where the total sales line and total cost line meet. The vertical dotted line drawn downward from the intersection point reaches at 8,000 units. It indicates the break-even sales (units). The horizontal line drawn to the left towards the vertical axis reaches at $1,920,000. It indicates the break-even sales (dollars). Refer Part 3 for the break-even values.
The operating profit area is the area where the total sales line exceeds the total cost line. However, the operating loss area is the area where the total cost exceeds the total sales line.
5.
the expected margin of safety in dollars and as a percentage of sales.
5.
Explanation of Solution
Determine the expected margin of safety in dollars.
Sales =$2,880,000 (1)
Sales at break-even point =$1,920,000 (refer Part 3)
Determine the expected margin of safety as a percentage of sales.
Sales =$2,880,000 (1)
Margin of Safety in dollars =$960,000
Therefore, the expected margin of safety in dollars is $960,000 and as a percentage of sales is 33.3%.
6.
the operating leverage.
6.
Explanation of Solution
Determine the operating leverage.
Contribution margin =$1,728,000 (11)
Income from operations =$576,000 (refer Table 1)
Working note:
Determine the contribution margin
Sales =$2,880,000 (1)
Variable cost =$1,152,000 (9)
Therefore, the operating leverage is 3.
Want to see more full solutions like this?
Chapter 19 Solutions
Bundle: Financial & Managerial Accounting, Loose-Leaf Version, 13th + CengageNOWv2, 2 terms Printed Access Card


- Kendrick Company prepares monthly financial statements and uses the gross profit method to estimate ending inventories. Historically, the company has had a 40% gross profit rate. During August, net sales amounted to $350,000; the beginning inventory on August 1 was $85,000; and the cost of goods purchased during August amounted to $190,000. The estimated cost of Kendrick Company's inventory on August 31 is ____. A. $26,000 B. $50,000 C. $78,000 D. $65,000arrow_forwardDuring FY 2021 GE Production had total manufacturing costs of$583,000. Their cost of goods manufactured for the year was $527,000. The January 1, 2022 balance of Work-in-Process Inventory is $92,000. Use this information to determine the dollar amount of the FY 2021 beginning Work-in-Process Inventory.arrow_forwardI need help with this financial accounting question using accurate methods and procedures.arrow_forward
- Compute the depreciation charge for 2018.arrow_forwardWhat will be the depreciation expense in each of the remaining 5 years?arrow_forwardA business started the year with inventory worth $35,000. During the year, it purchased additional inventory for $150,000 and ended the year with inventory valued at $42,000. What was the cost of goods sold for the year?arrow_forward
- Given solution for General accounting question not use aiarrow_forwardGranada Company uses the weighted-average method in its process costing system. The first processing department, the Mixing Department, started the month with 20,000 units in its beginning work in process inventory that were 40% complete with respect to conversion costs. The conversion cost in this beginning work-in-process inventory was $32,000. An additional 100,000 units were started into production during the month and 95,000 units were completed in the Mixing Department and transferred to the next processing department. There were 25,000 units in the ending work-in-process inventory of the Mixing Department that were 30% complete with respect to conversion costs. A total of $518,000 in conversion costs were incurred in the department during the month. What would be the cost per equivalent unit for conversion costs for the month? A. $4.89 B. $5.37 C. $4.75 D. $6.21arrow_forwardPlease provide the correct answer to this general accounting problem using valid calculations.arrow_forward
 Managerial AccountingAccountingISBN:9781337912020Author:Carl Warren, Ph.d. Cma William B. TaylerPublisher:South-Western College Pub
 Financial And Managerial AccountingAccountingISBN:9781337902663Author:WARREN, Carl S.Publisher:Cengage Learning,
 Cornerstones of Cost Management (Cornerstones Ser...AccountingISBN:9781305970663Author:Don R. Hansen, Maryanne M. MowenPublisher:Cengage Learning
 Principles of Accounting Volume 2AccountingISBN:9781947172609Author:OpenStaxPublisher:OpenStax College
 College Accounting, Chapters 1-27AccountingISBN:9781337794756Author:HEINTZ, James A.Publisher:Cengage Learning,