1.
Cost-Volume-Profit Analysis: It is a method followed to analyze the relationship between the sales, costs, and the related profit or loss at various levels of units sold. In other words, it shows the effect of the changes in the cost and the sales volume on the operating income of the company.
To construct: a cost-volume-profit chart indicating the break-even sales for last year.
1.
Explanation of Solution
Construct a cost-volume-profit chart indicating the break-even sales for last year.
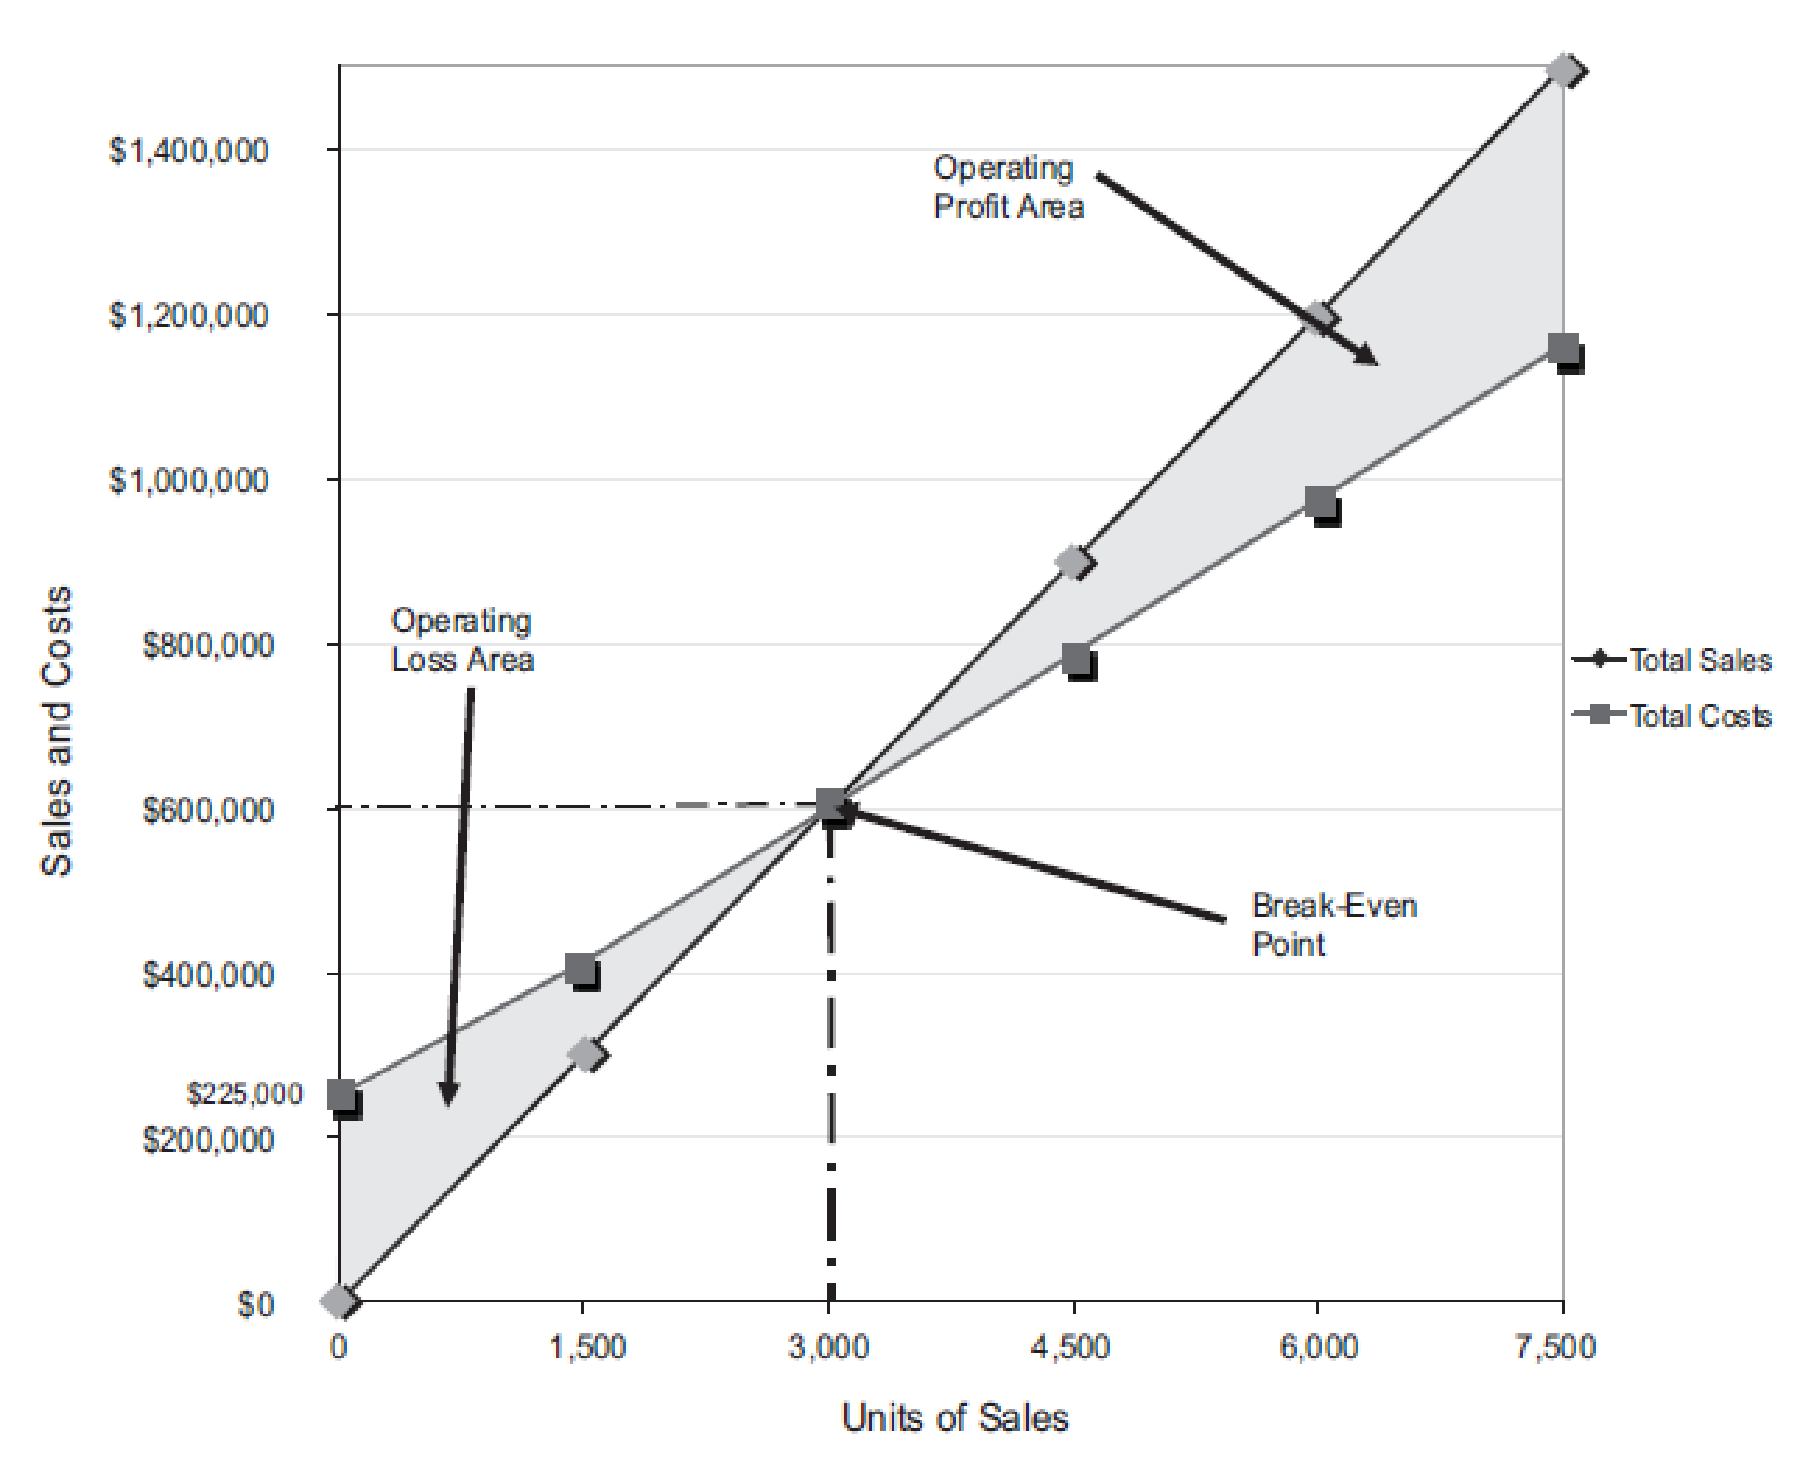
Figure (1)
The volume in units of sales is shown on the horizontal axis. The maximum relevant range is 7,500 units. The sales and the total costs (fixed cost and variable cost) in dollars is shown on the vertical axis. The maximum relevant range of sales and total costs is $1,500,000.
The total sales line is drawn right upward by connecting the first point at $0 to the second point at $1,500,000
The total cost line is drawn right upward by connecting the first point at $225,000 (fixed cost) on the vertical axis to the second point at $1,162,500
The break-even point is the intersection point where the total sales line and total cost line meet. The vertical dotted line drawn downward from the intersection point reaches at 3,000 units. It indicates the break-even sales (units). The horizontal line drawn to the left towards the vertical axis reaches at $600,000. It indicates the break-even sales (dollars).
The operating profit area is the area where the total sales line exceeds the total cost line. However, the operating loss area is the area where the total cost exceeds the total sales line.
Verify the answer using the break-even equation.
Determine the break-even sales in units.
Fixed cost =$225,000
Contribution margin per unit =$75 per unit (1)
Working note:
Compute the contribution margin per unit.
Selling price per unit =$200 per unit
Variable cost per unit =$125 per unit
Determine the break-even sales in dollars.
Fixed cost =$225,000
Contribution margin ratio =37.5% (2)
Working note:
Determine the contribution margin ratio.
Contribution margin =$75 per unit (1)
Selling price per unit =$200 per unit
2.
(A) the income from operations for last year and (B) the maximum income from operations that could have been realized during the year using the cost-volume-profit chart..
2.
Explanation of Solution
Determine (A) the income from operations for last year and (B) the maximum income from operations that could have been realized during the year.
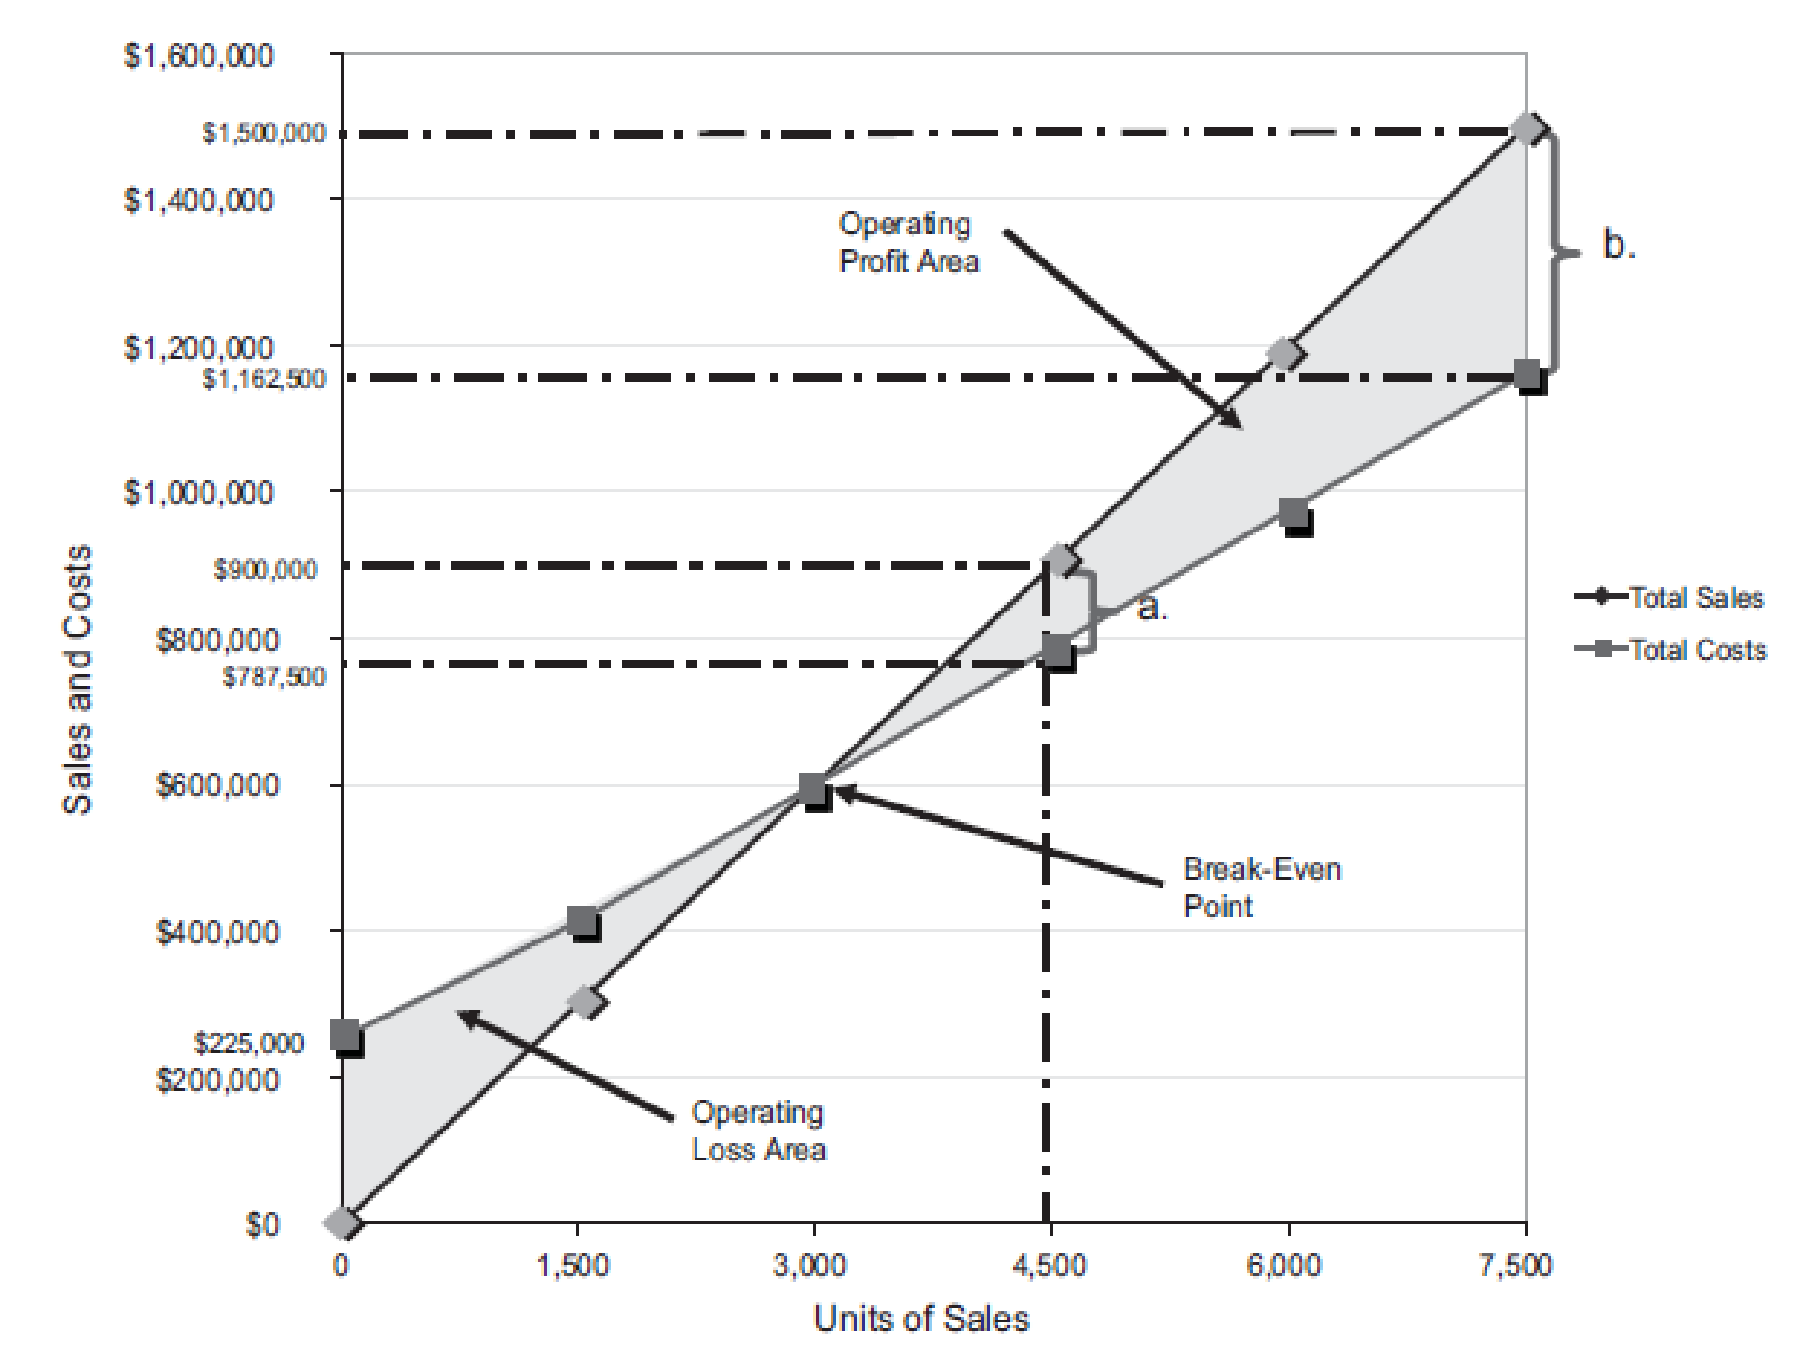
Figure (2)
(A)
Last year, the number of units sold is 4,500 units (3). The total sales is $900,000. The total cost is
Similarly, a dotted line is drawn from the total cost at $787,500 on the vertical axis towards the right and a dotted line is drawn upward for the 4,500 units sold from the horizontal axis. The two dotted line meet at a point which indicates the point of total cost at 4,500 units.
The dotted line from sales is above the dotted line for total cost. This indicates the income from operations. Thus, the area in between the two dotted lines is the income from operations of
(B)
The maximum relevant range for number of units to be sold is 7,500 units. Thus, the total sales are
Similarly, a dotted line is drawn from the total cost at $1,162,500 on the vertical axis towards the right and a dotted line is drawn upward for the 7,500 units sold from the horizontal axis. The two dotted line meet at a point which indicates the point of total cost at 7,500 units.
The dotted line from sales is above the dotted line for total cost. This indicates the income from operations. Thus, the area in between the two dotted lines is the income from operations of
Verify the answers using the mathematical approach to cost-volume-profit analysis.
(A)
Determine the income from operations for the last year.
| Determine the income from operations for 4,500 units | ||
| Particulars | Amount ($) | Amount ($) |
| Sales | 900,000 | |
| Less: Fixed costs | 225,000 | |
| Variable costs | 562,500 | (787,500) |
| Income from operations | 112,500 | |
Table (1)
Working note (3):
Determine the number of units sold.
Sales =$900,000
Selling price per unit =$200 per unit
(B)
Determine the maximum income from operations that could have been realized during the year.
| Determine the income from operations for 7,500 units | ||
| Particulars | Amount ($) | Amount ($) |
| Sales | 1,500,000 | |
| Less: Fixed costs | 225,000 | |
| Variable costs | 937,500 | (1,162,500) |
| Income from operations | 337,500 | |
Table (2)
3.
To construct: a cost-volume-profit chart indicating the break-even sales for the current year.
3.
Explanation of Solution
Construct a cost-volume-profit chart indicating the break-even sales for the current year.
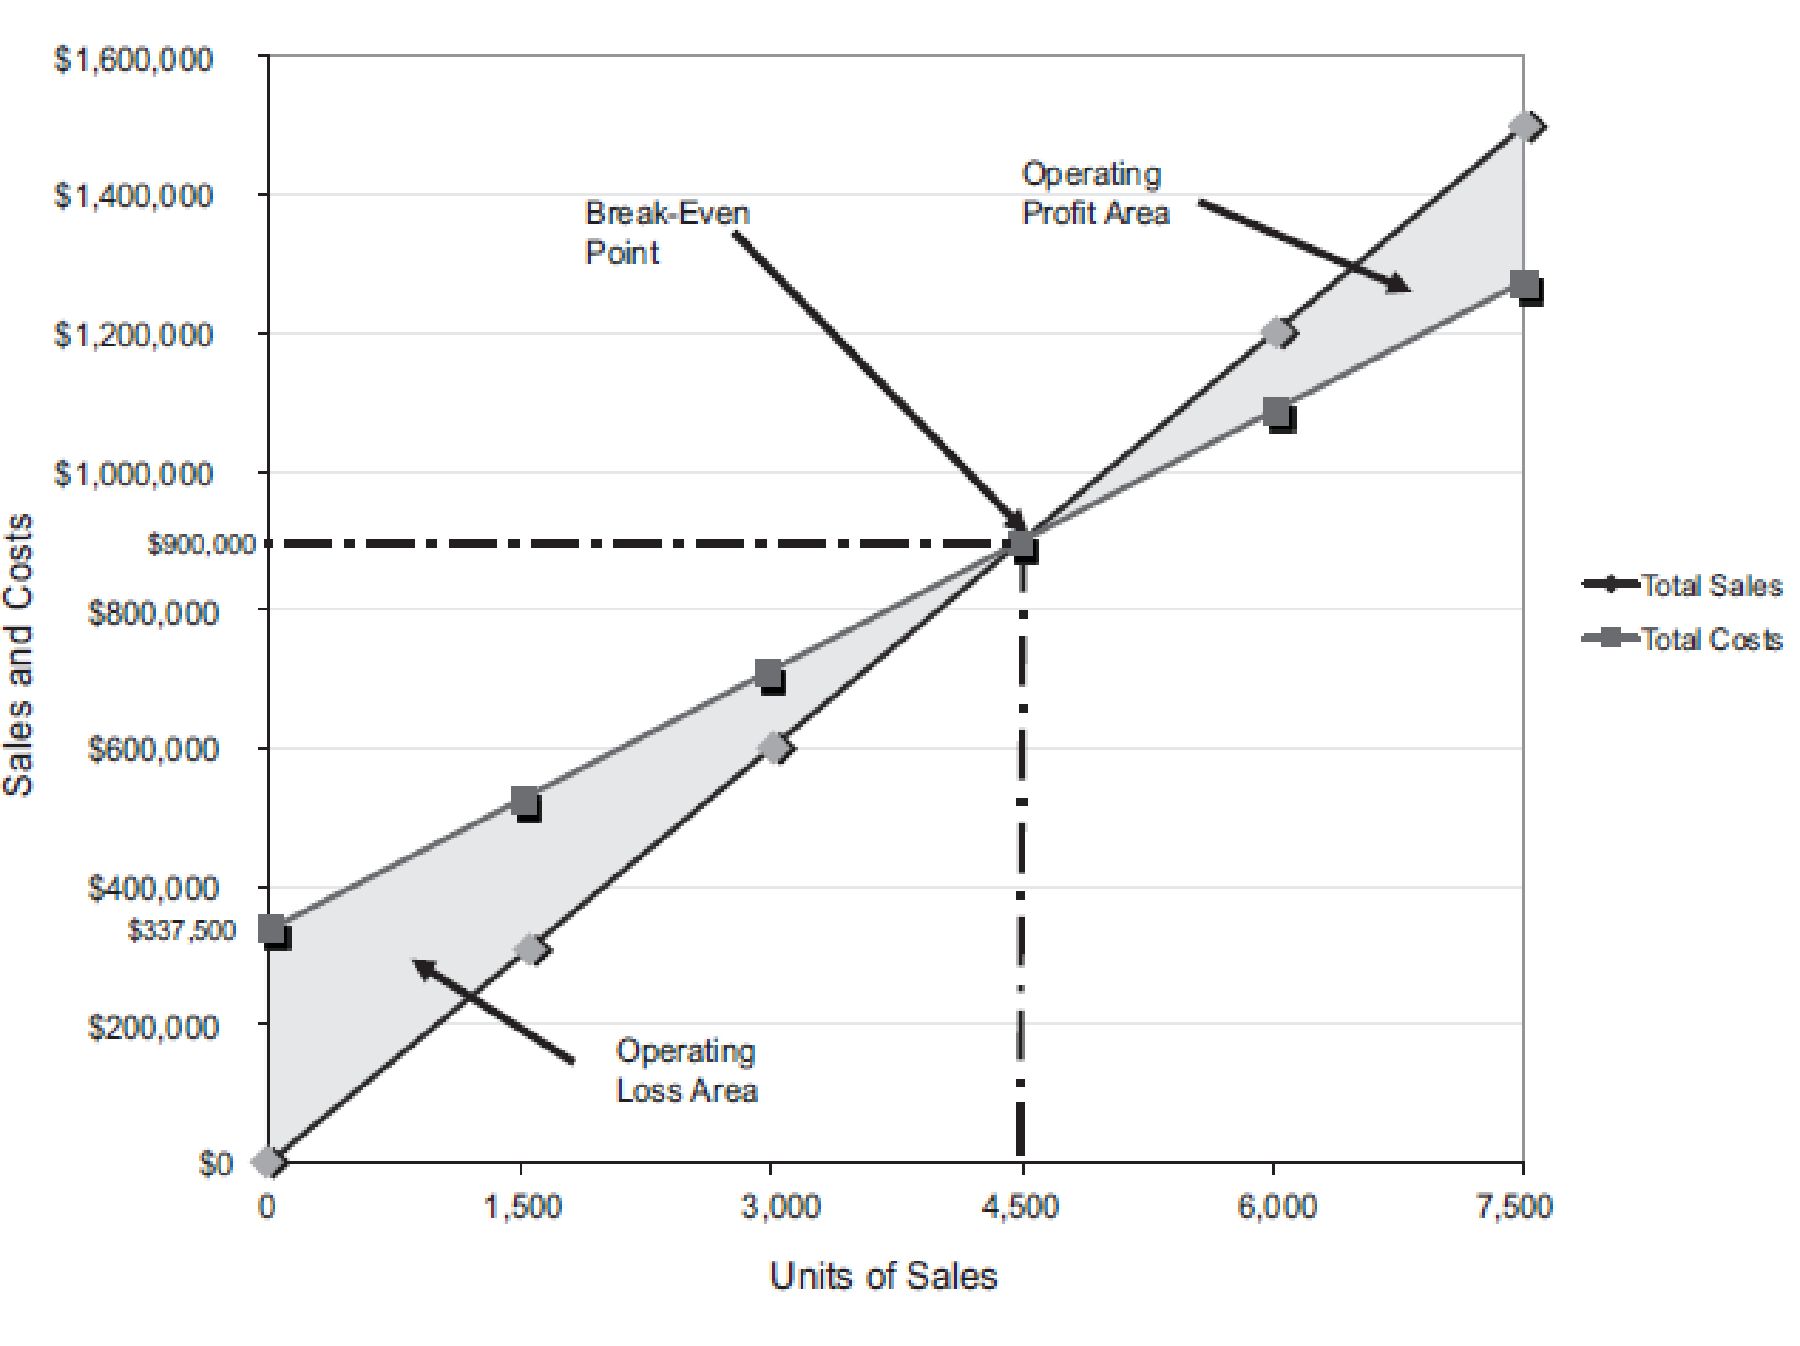
Figure (3)
The volume in units of sales is shown on the horizontal axis. The maximum relevant range is 7,500 units. The sales and the total costs (fixed cost and variable cost) in dollars is shown on the vertical axis. The maximum relevant range of sales and total costs is $1,600,000.
The total sales line is drawn right upward by connecting the first point at $0 to the second point at $900,000
The total cost line is drawn right upward by connecting the first point at
The break-even point is the intersection point where the total sales line and total cost line meet. The vertical dotted line drawn downward from the intersection point reaches at 4,500 units. It indicates the break-even sales (units). The horizontal line drawn to the left towards the vertical axis reaches at $900,000. It indicates the break-even sales (dollars).
The operating profit area is the area where the total sales line exceeds the total cost line. However, the operating loss area is the area where the total cost exceeds the total sales line.
Verify the answer using the break-even equation.
Determine the break-even sales in units.
Fixed cost =$225,000
Increase in fixed cost (billboard advertising) =$112,500
Contribution margin per unit =$75 per unit (1)
Determine the break-even sales in dollars.
Fixed cost =$225,000
Increase in fixed cost (billboard advertising) =$112,500
Contribution margin ratio =37.5% (2)
4.
(A) the income from operations for sales 6,000 units and (B) the maximum income from operations that could have been realized during the year using the cost-volume-profit chart..
4.
Explanation of Solution
Determine (A) the income from operations for sales 6,000 units and (B) the maximum income from operations that could have been realized during the year.
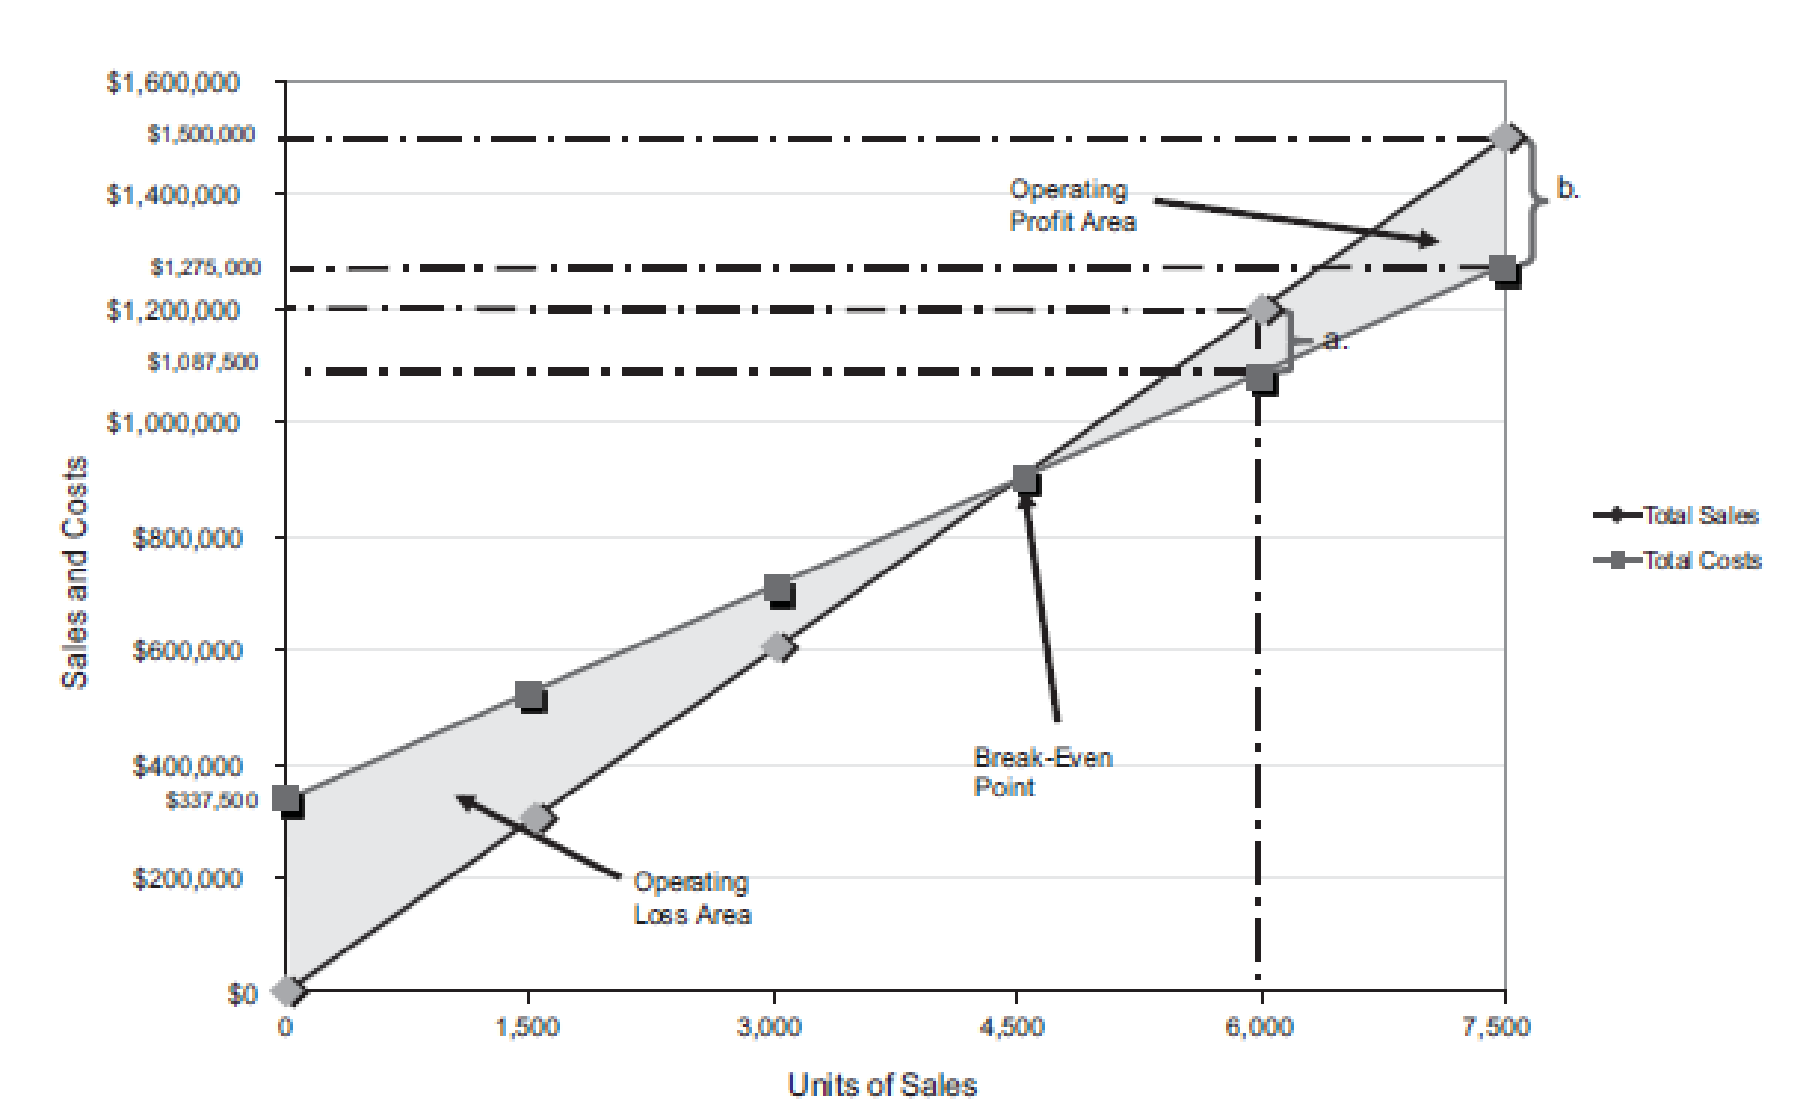
Figure (4)
(A)
The number of units sold is 6,000 units. The total sales is
Similarly, a dotted line is drawn from the total cost at $1,087,500 on the vertical axis towards the right and a dotted line is drawn upward for the 6,000 units sold from the horizontal axis. The two dotted line meet at a point which indicates the point of total cost at 6,000 units.
The dotted line from sales is above the dotted line for total cost. This indicates the income from operations. Thus, the area in between the two dotted lines is the income from operations of
(B)
The maximum relevant range for number of units to be sold is 7,500 units. Thus, the total sales are
Similarly, a dotted line is drawn from the total cost at $1,275,000 on the vertical axis towards the right and a dotted line is drawn upward for the 7,500 units sold from the horizontal axis. The two dotted line meet at a point which indicates the point of total cost at 7,500 units.
The dotted line from sales is above the dotted line for total cost. This indicates the income from operations. Thus, the area in between the two dotted lines is the income from operations of
Verify the answers using the mathematical approach to cost-volume-profit analysis.
(A)
Determine the income from operations for the last year.
| Determine the income from operations for 6,000 units | ||
| Particulars | Amount ($) | Amount ($) |
| Sales | 1,200,000 | |
| Less: Total Fixed costs | 337,500 | |
| Variable costs | 750,000 | (1,087,500) |
| Income from operations | 112,500 | |
Table (3)
(B)
Determine the maximum income from operations that could have been realized during the year.
| Determine the income from operations for 7,500 units | ||
| Particulars | Amount ($) | Amount ($) |
| Sales | 1,500,000 | |
| Less: Total Fixed costs | 337,500 | |
| Variable costs | 937,500 | (1,275,000) |
| Income from operations | 225,000 | |
Table (4)
Want to see more full solutions like this?
Chapter 19 Solutions
Bundle: Financial & Managerial Accounting, Loose-Leaf Version, 13th + CengageNOWv2, 2 terms Printed Access Card

- I am looking for the correct answer to this financial accounting question with appropriate explanations.arrow_forwardResidentside Manufacturing has the following data: direct labor $215,000, direct materials used $185,000, total manufacturing overhead $205,000,and beginning work in process inventory $45,000. Compute the total manufacturing costs and the total cost of work in process.arrow_forwardMC Company made sales to two customers. Both sales were on credit terms of 2/10, n/30. Customer A purchased $30,000 of goods, returned none, and paid in 9 days. Customer B purchased $40,000 of goods, returned, and was given credit for $4,000 of goods and paid in 25 days. What was the net revenue from these two customers?arrow_forward
- Crestview Manufacturing produces a product with a standard direct labor cost of 2.2 hours at $21.75 per hour. During September, 1,850 units were produced using 3,980 hours at $20.25 per hour. The labor quantity variance was $__. No AI ANSWERarrow_forwardNonearrow_forwardFinancial Accountingarrow_forward
 Cornerstones of Cost Management (Cornerstones Ser...AccountingISBN:9781305970663Author:Don R. Hansen, Maryanne M. MowenPublisher:Cengage Learning
 Excel Applications for Accounting PrinciplesAccountingISBN:9781111581565Author:Gaylord N. SmithPublisher:Cengage Learning