
1.
Cost-Volume-Profit Analysis: It is a method followed to analyze the relationship between the sales, costs, and the related profit or loss at various levels of units sold. In other words, it shows the effect of the changes in the cost and the sales volume on the operating income of the company.
To construct: a cost-volume-profit chart indicating the break-even sales for last year.
1.
Explanation of Solution
Construct a cost-volume-profit chart indicating the break-even sales for last year.
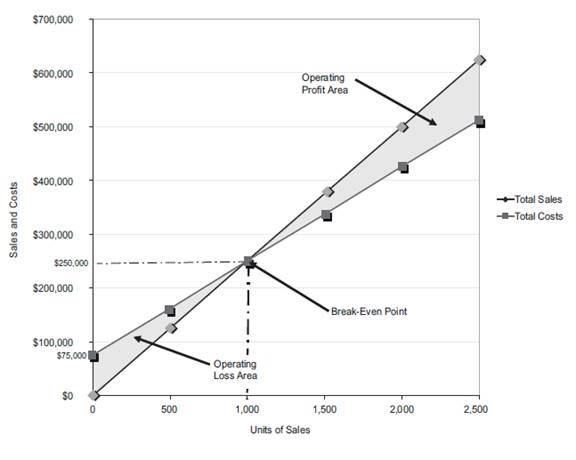
Figure (1)
The volume in units of sales is shown on the horizontal axis. The maximum relevant range is 2,500 units. The sales and the total costs (fixed cost and variable cost) in dollars is shown on the vertical axis. The maximum relevant range of sales and total costs is $700,000.
The total sales line is drawn right upward by connecting the first point at $0 to the second point at $625,000
The total cost line is drawn right upward by connecting the first point at $75,000 (fixed cost) on the vertical axis to the second point at $512,500
The break-even point is the intersection point where the total sales line and total cost line meet. The vertical dotted line drawn downward from the intersection point reaches at 1,000 units. It indicates the break-even sales (units). The horizontal line drawn to the left towards the vertical axis reaches at $250,000. It indicates the break-even sales (dollars).
The operating profit area is the area where the total sales line exceeds the total cost line. However, the operating loss area is the area where the total cost exceeds the total sales line.
2(A)
The income from operations for last year
2(A)
Explanation of Solution
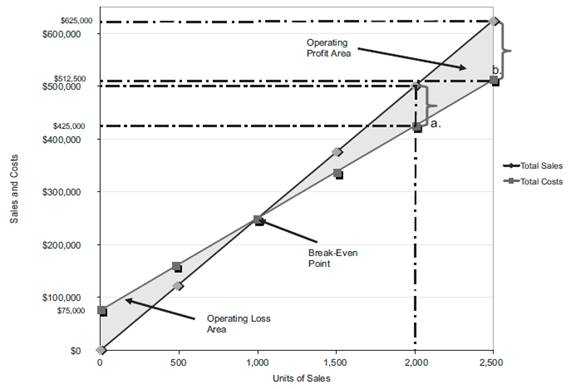
Figure (2)
Last year, the number of units sold is 2,000 units (3). The total sales is $500,000. The total cost is
Similarly, a dotted line is drawn from the total cost at $425,000 on the vertical axis towards the right and a dotted line is drawn upward for the 2,000 units sold from the horizontal axis. The two dotted line meet at a point which indicates the point of total cost at 2,000 units.
The dotted line from sales is above the dotted line for total cost. This indicates the income from operations. Thus, the area in between the two dotted lines is the income from operations of
2(B)
The maximum income from operations realized during the year.
2(B)
Explanation of Solution
The maximum relevant range for number of units to be sold is 2,500 units. Thus, the total sale is
Similarly, a dotted line is drawn from the total cost at $512,500 on the vertical axis towards the right and a dotted line is drawn upward for the 2,500 units sold from the horizontal axis. The two dotted line meet at a point which indicates the point of total cost at 2,500 units.
The dotted line from sales is above the dotted line for total cost. This indicates the income from operations. Thus, the area in between the two dotted lines is the income from operations of
2(A)
To verify: the answers using the mathematical approach to cost-volume-profit analysis.
2(A)
Explanation of Solution
Verify the answers using the mathematical approach to cost-volume-profit analysis.
Determine the income from operations for the last year.
| Determine the income from operations for 2,000 units | ||
| Particulars | Amount ($) | Amount ($) |
| Sales | 500,000 | |
| Less: Fixed costs | 75,000 | |
| Variable costs
|
350,000 | (425,000) |
| Income from operations | 75,000 | |
Table (1)
Working note:
Determine the number of units sold.
Sales =$500,000
Selling price per unit =$250 per unit
2(B)
the maximum income from operations that could have been realized during the year.
2(B)
Explanation of Solution
| Determine the income from operations for 2,500 units | ||
| Particulars | Amount ($) | Amount ($) |
| Sales
|
625,000 | |
| Less: Fixed costs | 75,000 | |
| Variable costs
|
437,500 | (512,500) |
| Income from operations | 112,500 | |
Table (2)
3.
To construct: a cost-volume-profit chart indicating the break-even sales for the current year.
3.
Explanation of Solution
Construct a cost-volume-profit chart indicating the break-even sales for the current year.
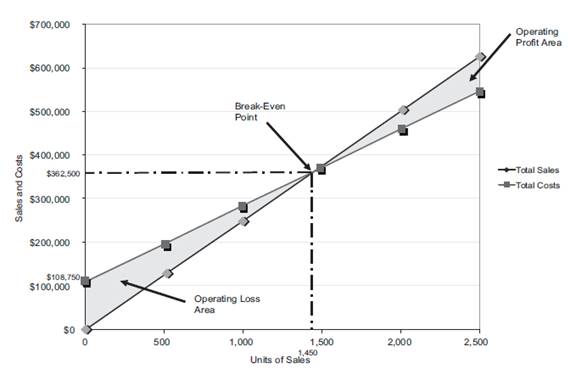
Figure (3)
The volume in units of sales is shown on the horizontal axis. The maximum relevant range is 2,500 units. The sales and the total costs (fixed cost and variable cost) in dollars is shown on the vertical axis. The maximum relevant range of sales and total costs is $700,000.
The total sales line is drawn right upward by connecting the first point at $0 to the second point at $625,000
The total cost line is drawn right upward by connecting the first point at
The break-even point is the intersection point where the total sales line and total cost line meet. The vertical dotted line drawn downward from the intersection point reaches at 1,450 units. It indicates the break-even sales (units). The horizontal line drawn to the left towards the vertical axis reaches at $362,500. It indicates the break-even sales (dollars).
The operating profit area is the area where the total sales line exceeds the total cost line. However, the operating loss area is the area where the total cost exceeds the total sales line.
4(A)
the income from operations for sales 2,000 units
4(A)
Explanation of Solution
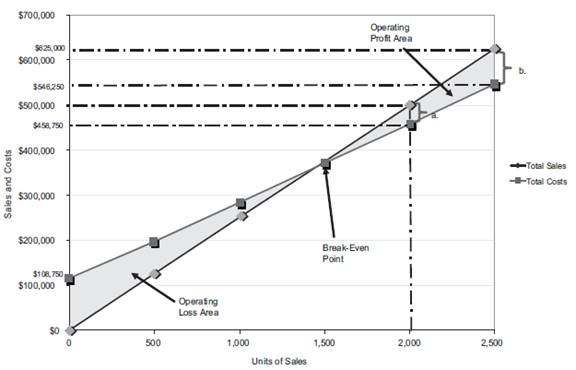
Figure (4)
Last year, the number of units sold is 2,000 units (3). The total sales is $500,000. The total cost is
Similarly, a dotted line is drawn from the total cost at $458,750 on the vertical axis towards the right and a dotted line is drawn upward for the 2,000 units sold from the horizontal axis. The two dotted line meet at a point which indicates the point of total cost at 2,000 units.
The dotted line from sales is above the dotted line for total cost. This indicates the income from operations. Thus, the area in between the two dotted lines is the income from operations of
4(B)
The maximum income from operations that could have been realized during the year.
4(B)
Explanation of Solution
The maximum relevant range for number of units to be sold is 2,500 units. Thus, the total sales is
Similarly, a dotted line is drawn from the total cost at $546,250 on the vertical axis towards the right and a dotted line is drawn upward for the 2,500 units sold from the horizontal axis. The two dotted line meet at a point which indicates the point of total cost at 2,500 units.
The dotted line from sales is above the dotted line for total cost. This indicates the income from operations. Thus, the area in between the two dotted lines is the income from operations of
4(A)
To verify: the answers using the mathematical approach to cost-volume-profit analysis.
4(A)
Explanation of Solution
Verify the answers using the mathematical approach to cost-volume-profit analysis.
Determine the income from operations for the last year.
| Determine the income from operations for 2,000 units | ||
| Particulars | Amount ($) | Amount ($) |
| Sales | 500,000 | |
| Less: Total Fixed costs
|
108,750 | |
| Variable costs
|
350,000 | (458,750) |
| Income from operations | 41,250 | |
Table (3)
4(B)
the maximum income from operations that could have been realized during the year.
4(B)
Explanation of Solution
| Determine the income from operations for 2,500 units | ||
| Particulars | Amount ($) | Amount ($) |
| Sales
|
625,000 | |
| Less: Total Fixed costs
|
108,750 | |
| Variable costs
|
437,500 | (546,250) |
| Income from operations | 78,750 | |
Table (4)
Want to see more full solutions like this?
Chapter 19 Solutions
Financial & Managerial Accounting

- Xander Industries has a balanced day of 31 December. On 1 January 2XX5, it had an opening inventory balance of $32,500. Xander Industries purchased $48,700 worth of goods for resale. On 31 December 2XX5, the closing inventory balance was $19,200. During the year, Xander Industries had sales of $74,000. What is the Cost of Goods Sold for Xander Industries for the period ending 31 December 2XX5?arrow_forwardPlease provide the correct answer to this general accounting problem using accurate calculations.arrow_forwardProvide solutionarrow_forward
- Can you explain the correct methodology to solve this general accounting problem?arrow_forwardFinancial accountingarrow_forwardMoonlight Ltd. had 25,000 units of ending inventory recorded at $8.20 per unit using the FIFO method. The current replacement cost is $6.10 per unit. Which amount should be reported as Ending Merchandise Inventory on the balance sheet using the lower-of-cost-or-market rule?arrow_forward
- What was its charge for depreciation and amortization?arrow_forwardI need the correct answer to this general accounting problem using the standard accounting approach.arrow_forwardKFC Industries estimates direct labor costs and manufacturing overhead costs for the upcoming year to be $920,000 and $740,000, respectively. KFC allocates overhead costs based on machine hours. The estimated total labor hours and machine hours for the coming year are 23,000 hours and 9,250 hours, respectively. What is the predetermined overhead allocation rate? (Round your answer to the nearest cent.)arrow_forward
 Cornerstones of Cost Management (Cornerstones Ser...AccountingISBN:9781305970663Author:Don R. Hansen, Maryanne M. MowenPublisher:Cengage Learning
 Excel Applications for Accounting PrinciplesAccountingISBN:9781111581565Author:Gaylord N. SmithPublisher:Cengage Learning
 Managerial AccountingAccountingISBN:9781337912020Author:Carl Warren, Ph.d. Cma William B. TaylerPublisher:South-Western College Pub