Bundle: Statistics for Business & Economics, Loose-Leaf Version, 13th + MindTap Business Statistics with XLSTAT, 1 term (6 months) Printed Access Card
13th Edition
ISBN: 9781337148092
Author: David R. Anderson, Dennis J. Sweeney, Thomas A. Williams, Jeffrey D. Camm, James J. Cochran
Publisher: Cengage Learning
expand_more
expand_more
format_list_bulleted
Textbook Question
Chapter 18.2, Problem 12E
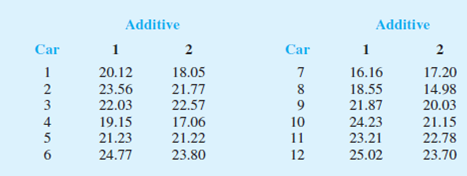
Two fuel additives are tested to determine their effect on miles per gallon for passenger cars. Test results for 12 cars follow; each car was tested with both fuel additives. Use α = .05 and the Wilcoxon signed-rank test to see whether there is a significant difference between the

Expert Solution & Answer
Trending nowThis is a popular solution!

Students have asked these similar questions
7.1. If X has an exponential distribution with the
parameter 0, use the distribution function technique
to find the probability density of the random variable
Y = ln X.
bilaga in
dwreat
3. Please
What does the margin of error include? When a margin of error is reported for a survey, it includes
a. random sampling error and other practical difficulties like undercoverage and non-response
b. random sampling error, but not other practical difficulties like undercoverage and nonresponse
c. practical difficulties like undercoverage and nonresponse, but not random smapling error
d. none of the above is corret
Chapter 18 Solutions
Bundle: Statistics for Business & Economics, Loose-Leaf Version, 13th + MindTap Business Statistics with XLSTAT, 1 term (6 months) Printed Access Card
Ch. 18.1 - The following hypothesis test is to be conducted....Ch. 18.1 - Ten individuals participated in a taste test...Ch. 18.1 - The median number of part-time employees at...Ch. 18.1 - Net assets for the 50 largest stock mutual funds...Ch. 18.1 - The median price of homes in Austin, Texas is...Ch. 18.1 - The median annual income for families living in...Ch. 18.1 - Prob. 7ECh. 18.1 - A Pew Research Center survey asked adults if their...Ch. 18.1 - In a recent poll six hundred adults were asked a...Ch. 18.1 - Nielsen Media Research identified Empire and the...
Ch. 18.1 - Competition in the personal computer market is...Ch. 18.2 - Two fuel additives are tested to determine their...Ch. 18.2 - A sample of 10 men was used in a study to test the...Ch. 18.2 - Percents of on-time arrivals for flights in the...Ch. 18.2 - A test was conducted for two overnight mail...Ch. 18.2 - The LPGA ANA Inspiration tournament was held in...Ch. 18.2 - The Scholastic Aptitude Test (SAT) consists of...Ch. 18.3 - Two fuel additives are being tested to determine...Ch. 18.3 - Samples of starting annual salaries for...Ch. 18.3 - The gap between the earnings of men and women with...Ch. 18.3 - Are Southern and Western states equally prone to...Ch. 18.3 - Each year Bloomberg Businessweek publishes...Ch. 18.3 - Police records show the following numbers of daily...Ch. 18.3 - A certain brand of microwave oven was priced at 10...Ch. 18.3 - Chicago Midway International Airport and...Ch. 18.4 - A sample of 15 consumers provided the following...Ch. 18.4 - Three admission test preparation programs are...Ch. 18.4 - Forty-minute workouts of one of the following...Ch. 18.4 - The National Football League (NFL) holds its...Ch. 18.4 - A large corporation sends many of its first-level...Ch. 18.4 - The better-selling candies are often high in...Ch. 18.5 - Consider the following set of rankings for a...Ch. 18.5 - Prob. 33ECh. 18.5 - Prob. 34ECh. 18.5 - A national study by Harris Interactive, Inc.,...Ch. 18.5 - Prob. 36ECh. 18.5 - A student organization surveyed both current...Ch. 18 - A survey asked the following question: Do you...Ch. 18 - Due to a recent decline in the housing market, the...Ch. 18 - Twelve homemakers were asked to estimate the...Ch. 18 - Prob. 41SECh. 18 - The following data are product weights for the...Ch. 18 - A client wants to determine whether there is a...Ch. 18 - Prob. 44SECh. 18 - Prob. 45SECh. 18 - Prob. 46SECh. 18 - Prob. 47SE
Knowledge Booster
Learn more about
Need a deep-dive on the concept behind this application? Look no further. Learn more about this topic, statistics and related others by exploring similar questions and additional content below.Similar questions
- solve the question based on hw 1, 1.41arrow_forwardT1.4: Let ẞ(G) be the minimum size of a vertex cover, a(G) be the maximum size of an independent set and m(G) = |E(G)|. (i) Prove that if G is triangle free (no induced K3) then m(G) ≤ a(G)B(G). Hints - The neighborhood of a vertex in a triangle free graph must be independent; all edges have at least one end in a vertex cover. (ii) Show that all graphs of order n ≥ 3 and size m> [n2/4] contain a triangle. Hints - you may need to use either elementary calculus or the arithmetic-geometric mean inequality.arrow_forwardWe consider the one-period model studied in class as an example. Namely, we assumethat the current stock price is S0 = 10. At time T, the stock has either moved up toSt = 12 (with probability p = 0.6) or down towards St = 8 (with probability 1−p = 0.4).We consider a call option on this stock with maturity T and strike price K = 10. Theinterest rate on the money market is zero.As in class, we assume that you, as a customer, are willing to buy the call option on100 shares of stock for $120. The investor, who sold you the option, can adopt one of thefollowing strategies: Strategy 1: (seen in class) Buy 50 shares of stock and borrow $380. Strategy 2: Buy 55 shares of stock and borrow $430. Strategy 3: Buy 60 shares of stock and borrow $480. Strategy 4: Buy 40 shares of stock and borrow $280.(a) For each of strategies 2-4, describe the value of the investor’s portfolio at time 0,and at time T for each possible movement of the stock.(b) For each of strategies 2-4, does the investor have…arrow_forward
- Negate the following compound statement using De Morgans's laws.arrow_forwardNegate the following compound statement using De Morgans's laws.arrow_forwardQuestion 6: Negate the following compound statements, using De Morgan's laws. A) If Alberta was under water entirely then there should be no fossil of mammals.arrow_forward
- Negate the following compound statement using De Morgans's laws.arrow_forwardCharacterize (with proof) all connected graphs that contain no even cycles in terms oftheir blocks.arrow_forwardLet G be a connected graph that does not have P4 or C3 as an induced subgraph (i.e.,G is P4, C3 free). Prove that G is a complete bipartite grapharrow_forward
arrow_back_ios
SEE MORE QUESTIONS
arrow_forward_ios
Recommended textbooks for you
 Glencoe Algebra 1, Student Edition, 9780079039897...AlgebraISBN:9780079039897Author:CarterPublisher:McGraw Hill
 College Algebra (MindTap Course List)AlgebraISBN:9781305652231Author:R. David Gustafson, Jeff HughesPublisher:Cengage Learning
 Big Ideas Math A Bridge To Success Algebra 1: Stu...AlgebraISBN:9781680331141Author:HOUGHTON MIFFLIN HARCOURTPublisher:Houghton Mifflin Harcourt

Glencoe Algebra 1, Student Edition, 9780079039897...
Algebra
ISBN:9780079039897
Author:Carter
Publisher:McGraw Hill

College Algebra (MindTap Course List)
Algebra
ISBN:9781305652231
Author:R. David Gustafson, Jeff Hughes
Publisher:Cengage Learning

Big Ideas Math A Bridge To Success Algebra 1: Stu...
Algebra
ISBN:9781680331141
Author:HOUGHTON MIFFLIN HARCOURT
Publisher:Houghton Mifflin Harcourt
Hypothesis Testing using Confidence Interval Approach; Author: BUM2413 Applied Statistics UMP;https://www.youtube.com/watch?v=Hq1l3e9pLyY;License: Standard YouTube License, CC-BY
Hypothesis Testing - Difference of Two Means - Student's -Distribution & Normal Distribution; Author: The Organic Chemistry Tutor;https://www.youtube.com/watch?v=UcZwyzwWU7o;License: Standard Youtube License