
Concept explainers
Videos
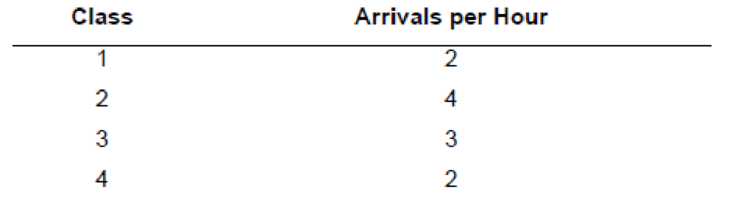
A priority waiting system assigns arriving customers to one of four classes. Arrival rates (Poisson) of the classes are shown in the following table. Five servers process the customers, and each can handle three customers per hour.
a. What is the system utilization?
b. What is the average wait for service by customers in the various classes? How many are waiting in each class, on average?
c. If the arrival rate of the second priority class could be reduced to three units per hour by shifting some arrivals into the third priority class, how would your answers to part b change?
d. What observations can you make based on your answers to part c?
a)
To determine: System utilization rate.
Introduction: Poisson distribution is utilized to ascertain the probability of an occasion happening over a specific time period or interval. The interval can be one of time, zone, volume or separation. The probability of an event happening is discovered utilizing the equation in the Poisson distribution.
Answer to Problem 16P
Explanation of Solution
Given Information:
It is given that the processing time is 3 customers per hour and there are 5 servers to process the customers.
| Class | Arrivals per Hour |
| 1 | 2 |
| 2 | 4 |
| 3 | 3 |
| 4 | 2 |
Calculate the system utilization:
It is calculated by adding all the total customer hours for each class and the result is divided with number of servers and customer process per hour.
Here,
M = number of servers
Hence the system utilization is 0.7333.
b)
To determine: The average customer waiting for service for each class and waiting in each class on average.
Answer to Problem 16P
Explanation of Solution
Given Information:
It is given that the processing time is 3 customers per hour and there are 5 servers to process the customers.
| Class | Arrivals per Hour |
| 1 | 2 |
| 2 | 4 |
| 3 | 3 |
| 4 | 2 |
Calculate the average number of customers:
It is calculated by dividing the total customers arrive per hour with customer process per hour.
Here,
r = average number of customers
Calculate average number of customers waiting for service (Lq) using infinite-source table values for
The Lq values for
Calculate A using Formula 18-16 from book:
It is calculated by subtracting 1 minus system utilization rate and multiplying the result with Lq, the whole result is divided by total customer arrival rate.
Here,
Lq = average number of customers waiting for service
Calculate B using Formula 18-17 from book for each category
It is calculated by multiplying number of servers with customer service process rate per hour and the result is divided by total customer arrival rate for each category.
Here,
M = number of servers
Calculate the average waiting time for class 1 and class 2
It is calculated by multiplying A with B0 and B1, the result is divided by 1.
Calculate the average number of customers that are waiting for service for class 1 and class 2:
It is calculated by multiplying total customer arrival rate with average waiting time for units in each category.
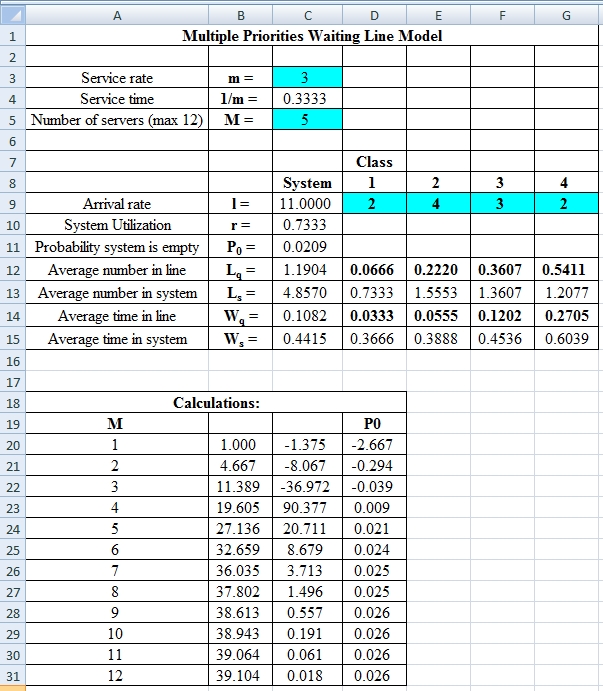
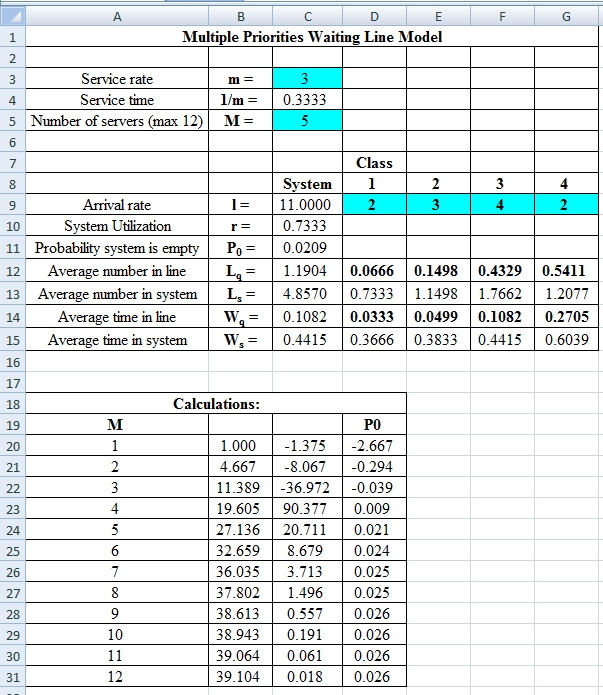
Excel Spreadsheet:
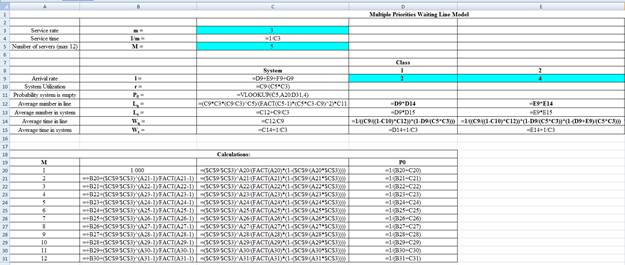
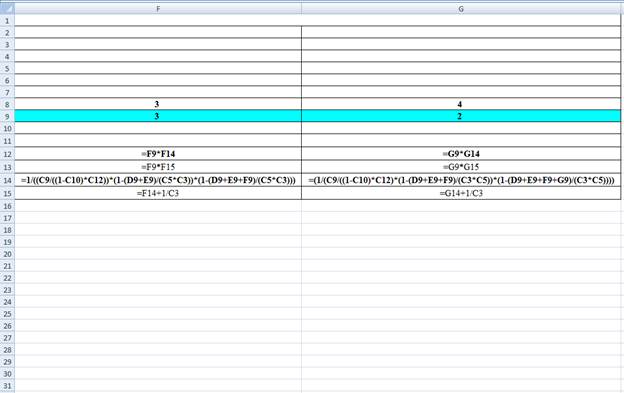
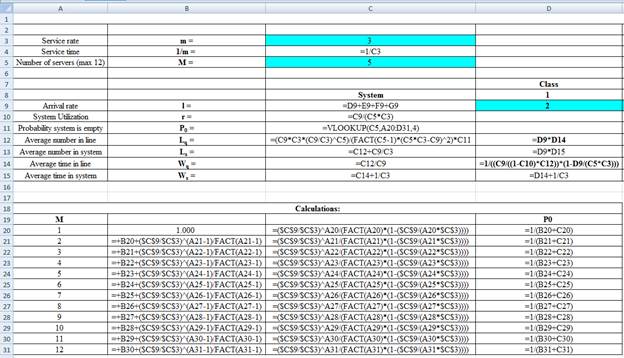
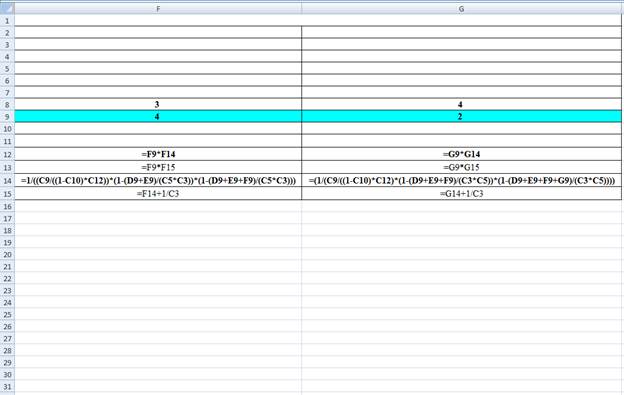
Excel Workings:
Hence the average wait time for service by customers for class 1 is 0.0333 hours, class 2 is 0.0555 hours, class 3 is 0.1202 hours and class 4 is 0.2705 hours. The waiting in each class on average for class 1 is 0.0666 customers, class 2 is 0.2220 customers, class 3 is 0.3607 customers and class 4 is 0.5411 customers.
c)
To determine: The average customer waiting for service for each class and waiting in each class on average.
Answer to Problem 16P
Explanation of Solution
Given Information:
It is given that the processing time is 3 customers per hour and there are 5 servers to process the customers. The second priority class is reduced to 3 units per hour by shifting some into the third party class. The arrival rate is as follows,
| Class | Arrivals per Hour |
| 1 | 2 |
| 2 | 3 |
| 3 | 4 |
| 4 | 2 |
Calculate the average number of customers
It is calculated by dividing the total customers arrive per hour with customer process per hour.
Here,
r = average number of customers
Calculate average number of customers waiting for service (Lq) using infinite-source table values for
The Lq values for
Calculate A using Formula 18-16 from book:
It is calculated by subtracting 1 minus system utilization rate and multiplying the result with Lq, the whole result is divided by total customer arrival rate.
Here,
Lq = average number of customers waiting for service
Calculate B using Formula 18-17 from book for each category
It is calculated by multiplying number of servers with customer service process rate per hour and the result is divided by total customer arrival rate for each category.
Here,
M = number of servers
Calculate the average waiting time for class 1 and class 2
It is calculated by multiplying A with B0 and B1, the result is divided by 1.
Calculate the average number of customers that are waiting for service for class 1 and class 2:
It is calculated by multiplying total customer arrival rate with average waiting time for units in each category.
Excel Spreadsheet:
Excel Workings:
Hence the average wait time for service by customers for class 1 is 0.0333 hours, class 2 is 0.0499 hours, class 3 is 0.1082 hours and class 4 is 0.2705 hours. The waiting in each class on average for class 1 is 0.0666 customers, class 2 is 0.1498 customers, class 3 is 0.4329 customers and class 4 is 0.5411 customers.
d)
To determine: The observations based on the results from part c.
Answer to Problem 16P
Explanation of Solution
Calculate the change in average wait time for each class.
It is calculated by subtracting the final answer for average wait time for service by customers from part b with the final answer for average wait time for service by customers from part c.
The above results suggest that there is a decrease in average wait time for class 2 and class 3. Class 1 and 4 remains constant.
Calculate the change in average number waiting for each class.
It is calculated by subtracting the final answer for waiting on average from part b with the final answer for waiting on average from part c.
The above results suggest that there is a decrease in average waiting for class 2 and an increase in class 3. Class 1 and 4 remains constant.
Want to see more full solutions like this?
Chapter 18 Solutions
EBK OPERATIONS MANAGEMENT


- I need the answer to requirement C.arrow_forwardImagine you are Susan Kim and are faced with a difficult choice to either follow the orders she was given, or refusing to do so. Using each lens determine what the ethical response would be. Suppot your answer with materials from readings and lectures. For example, using Universalism what would the ethical response be? Do the same for all four lenses.arrow_forwardAnswer all these questions, selecting any company of your choice. Choose a specific type of food company. Select a specific product. Develop all the inputs that are part of the process. Develop the transformation process in a graphic (diagram, etc.). Develop all the outputs or finished products that are part of the process. Describe all the processes involved in one line of production in any manufacturing facility. Also describing how good management is the center of any part of a production company.arrow_forward
- Using exponential smoothing with α =0.2, forecast the demand for The initial forecast for January is 2000 tons. Calculate the capacity utilization for June, July and Discuss the implications of underutilized or over utilized capacity for Green Harvestarrow_forwardIn organizational development when results are improving but relationships are declining, what leadership style is appropriate? directing delegating supporting coachingarrow_forwardWhat is the first thing a leader should do when moving through a cultural change? conduct an assessment comparing the practices to other high-performing organizations learn about the current organizational culture continue to monitor key metrics define expectationsarrow_forward
- The third change leadership strategy, Collaborate on Implementation, is designed to address what type of concerns? impact concerns personal concerns refinement concerns collaboration concernsarrow_forwardIf team members are concerned with specifics such as their tasks, contingency plans, resources, and timeline, what concerns do they have? implementation concerns impact concerns refinement concerns personal concernsarrow_forwardAt the developing stage of organizational development, which leadership style is most appropriate? supporting coaching delegating directingarrow_forward
- During the start-up phase of organizations, which leadership style is appropriate? supporting coaching directing delegatingarrow_forwardRegarding relationships and results, what is typically seen in start-up orgnanizations? low results/high relationships low results/low relationships high results/high relationships high results/ low relationshipsarrow_forwardWhat issues lie within Employee and Labor relations with hours worked and how to solve the issues effectively.arrow_forward
 Practical Management ScienceOperations ManagementISBN:9781337406659Author:WINSTON, Wayne L.Publisher:Cengage,
 MarketingMarketingISBN:9780357033791Author:Pride, William MPublisher:South Western Educational Publishing