
1. and 2.
Prepare cost of quality report for the year ended 2019 and 2020 showing sub-totals for each category and the category costs as a percentage of revenue for each year.
1. and 2.
Explanation of Solution
Prepare cost of quality report for the year ended 2019 and 2020.
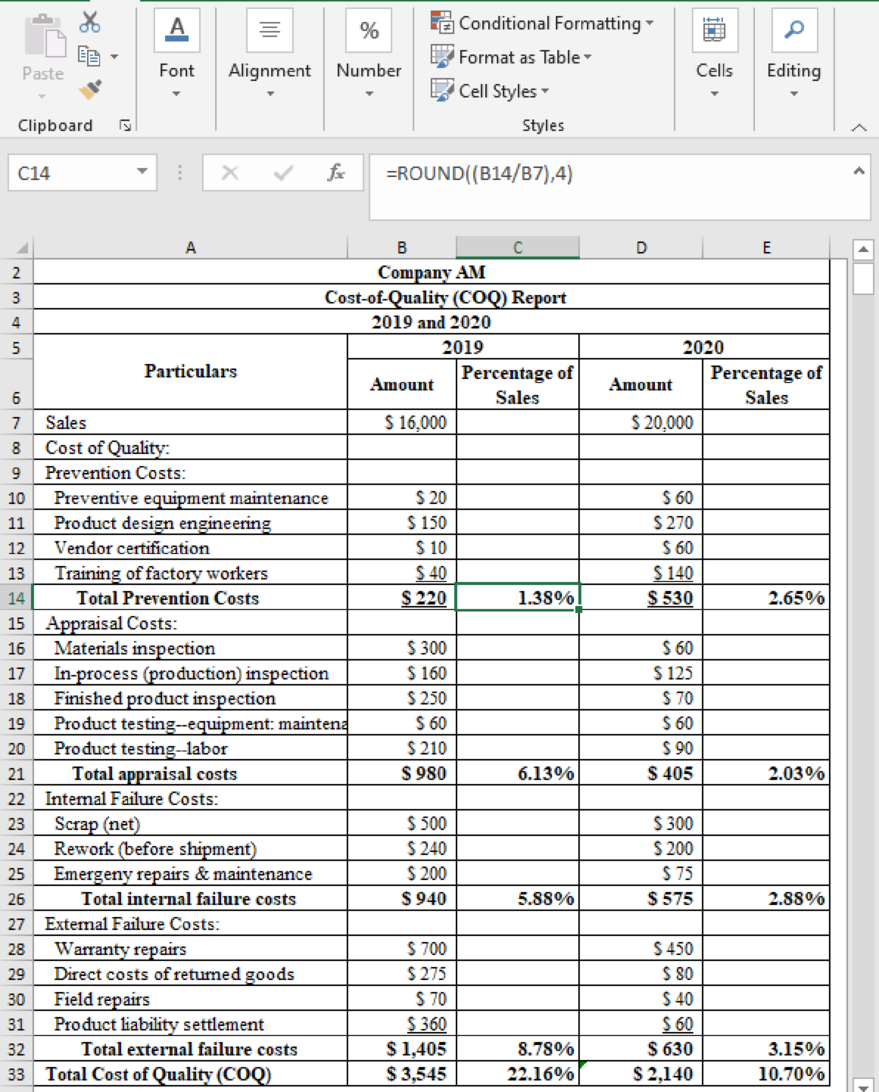
Table (1)
The formulae for the calculation are given below:
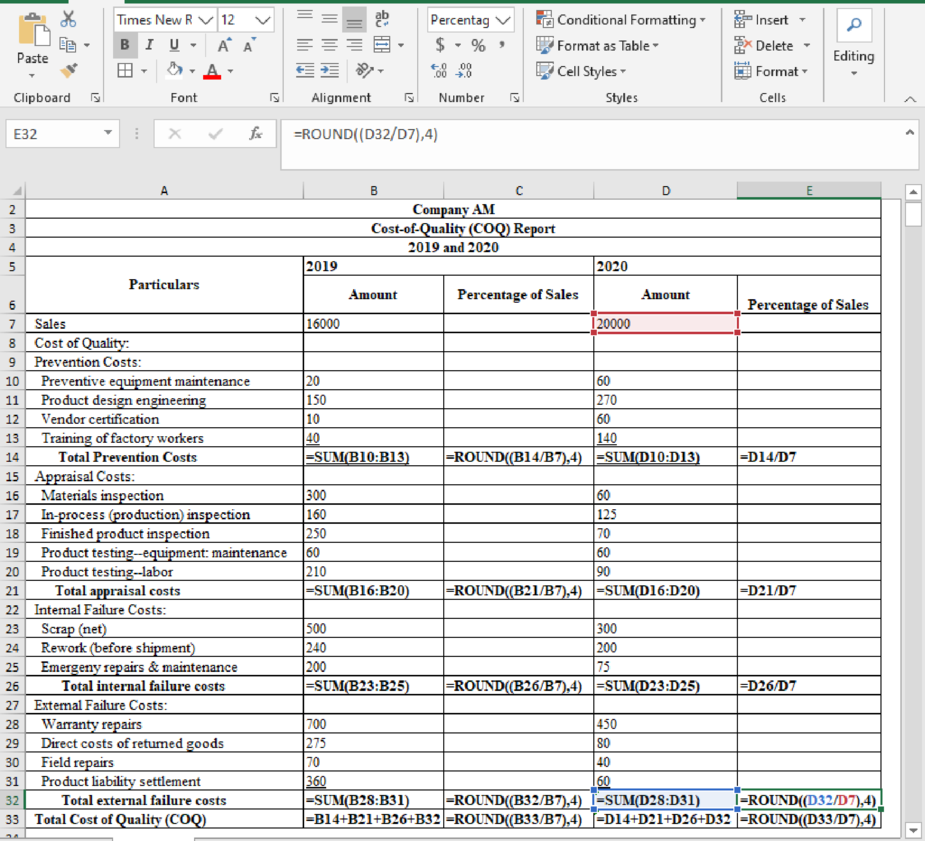
Table (2)
3. a.
Compute the percentage change in total COQ as a percentage of sales for the year 2019 and 2020.
3. a.
Explanation of Solution
Compute the percentage change in total COQ as a percentage of sales for the year 2019 and 2020.
| Particulars | Amount |
| 2019 COQ, as percentage of sales (A) | 22.16% |
| 2020 COQ, as percentage of sales (B) | 10.70% |
| Change in COQ as percentage of sales | -11.46% |
Table (3)
Thus, the change in total Cost of Quality (COQ) as a percentage of sales, from 2019 to 2020, is 11%.
3 b.
Compute the total COQ for year 2020 as a percentage of 2019 to sales dollars.
3 b.
Explanation of Solution
Compute the total COQ for year 2020 as a percentage of 2019 to sales dollars.
Thus, the total Cost of Quality (COQ) for year 2020 as a percentage of 2019 to sales dollars, is 13.38%.
3 c.
Compute the percentage change in total prevention costs from 2019 to 2020.
3 c.
Explanation of Solution
Compute the percentage change in total prevention costs from 2019 to 2020.
Thus, percentage change in total prevention costs has increased from 2019 to 2020 by $310 and 140.91%.
3 d.
Compute the percentage change in total appraisal costs from 2019 to 2020.
3 d.
Explanation of Solution
Compute the percentage change in total appraisal costs from 2019 to 2020.
Thus, percentage change in total prevention costs has decreased from 2019 to 2020 by $575 and 58.67%.
3 e.
Compute the percentage change in total internal failure costs from 2019 to 2020.
3 e.
Explanation of Solution
Compute the percentage change in total internal failure costs from 2019 to 2020.
Thus, percentage change in total internal failure has decreased from 2019 to 2020 by $365 and 38.83%.
3 f.
Compute the percentage change in total external failure costs from 2019 to 2020.
3 f.
Explanation of Solution
Compute the percentage change in total external failure costs from 2019 to 2020.
Thus, percentage change in total external failure has decreased from 2019 to 2020 by $775 and 55.16%.
4.
State the non-financial measures that would be monitored by Company AM to achieve overall improvements in quality.
4.
Explanation of Solution
The non-financial measures that would be monitored by Company AM to achieve overall improvements in quality are given below:
Internal Measures of Quality:
- The number of defects per period.
- Process yield (ratio of good output to total output).
- The percentage of defective units shipped to customers to total units of products shipped.
External Measures of Quality:
- The number of customer complaints.
- Difference between delivery date and date requested by the customer such as customer response time (CRT).
- On-time delivery percentage such as total units shipped on or before the scheduled date to the total units shipped.
- Surveys of customer satisfaction.
5.
Explain whether financial or non-financial measures are useful for (a) managers and (b) operating personnel.
5.
Explanation of Solution
The financial and nonfinancial quality data (metrics) plays an important role in a comprehensive framework for managing and controlling quality. The COQ (financial) data are reported only periodically that are more valuable information for the managers. The managers are the individuals responsible for the overall financial performance and making decisions on spending and investment regarding quality costs.
The non-financial quality data are useful for Operating personnel because such data are expressed in terms that are understandable/comprehensible to operating personnel. These measures emphasis the attention on processes, techniques, and procedures that are at the root cause of quality problems. In order to maximize the value of quality-related data, the information should be presented to the users as quickly as possible on a real-time basis.
Want to see more full solutions like this?
Chapter 17 Solutions
Cost Management

- Murray Industries applies manufacturing overhead to its cost objects on the basis of 75% of direct material cost. If Job 37A had $96,000 of manufacturing overhead applied to it during July, the direct materials assigned to Job 37A was: A. $72,000 B. $96,000 C. $128,000 D. $144,000arrow_forwardCompute the spending variance for materials.arrow_forwardCan you explain the process for solving this financial accounting question accurately?arrow_forward
- I need help with this general accounting problem using proper accounting guidelines.arrow_forwardPlease explain the correct approach for solving this general accounting question.arrow_forwardPlease provide the solution to this general accounting question with accurate financial calculations.arrow_forward
- Can you solve this general accounting problem with appropriate steps and explanations?arrow_forwardAccurate Answerarrow_forwardAt the beginning of the year, Momentum Corporation estimated its manufacturing overhead to be $425,000. At the end of the year, actual machine-hours were 34,500 hours, actual manufacturing overhead was $408,200, and manufacturing overhead was underapplied by $18,400. If the predetermined overhead rate is based on machine-hours, then the estimated machine-hours at the beginning of the year used in the predetermined overhead rate must have been: (Round your intermediate calculations to 2 decimal places.)arrow_forward

 AccountingAccountingISBN:9781337272094Author:WARREN, Carl S., Reeve, James M., Duchac, Jonathan E.Publisher:Cengage Learning,
 Accounting Information SystemsAccountingISBN:9781337619202Author:Hall, James A.Publisher:Cengage Learning,
 Horngren's Cost Accounting: A Managerial Emphasis...AccountingISBN:9780134475585Author:Srikant M. Datar, Madhav V. RajanPublisher:PEARSON
 Intermediate AccountingAccountingISBN:9781259722660Author:J. David Spiceland, Mark W. Nelson, Wayne M ThomasPublisher:McGraw-Hill Education
 Financial and Managerial AccountingAccountingISBN:9781259726705Author:John J Wild, Ken W. Shaw, Barbara Chiappetta Fundamental Accounting PrinciplesPublisher:McGraw-Hill Education