
Videos
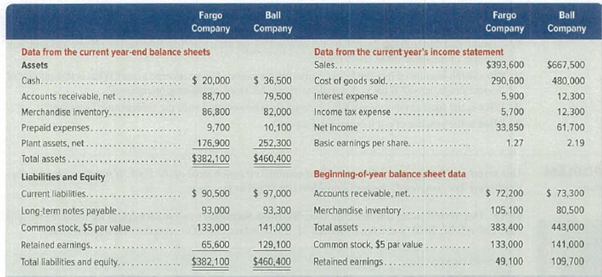
Summary information from the financial statements of two companies competing in the same industry follows.
Required
- 1. For both companies compute the (a)
current ratio , (b) acid-test ratio, (c)accounts receivable turnover, (d) inventory turnover, (e) days’ sales in inventory, and (f) days’ sales uncollected. Round to one decimal place. Identify the company you consider to be the better short-term credit risk and explain why. - 2. For both companies compute the (a) profit margin ratio, (b) total asset turnover, (c) return on total assets, and (d) return on common stockholders’ equity. Assuming that each company paid cash dividends of $1.50 per share and each company’s stock can be purchased at $25 per share, compute their (e) price-earnings ratios and (f) dividend yields. Round to one decimal place; for part b, round to two decimals. Identify which company’s stock you would recommend as the better investment and explain why.
1(a)
Compute the current ratio of Company F and Company B.
Explanation of Solution
Current ratio: Current ratio is one of the liquidity ratios, which measures the capacity of the company to meet its short-term obligations using its current assets. Current ratio is calculated by using the formula:
Compute the current ratio of Company F and Company B:
| Ratios | Company F | Company B |
| Cash | $20,000 | $36,500 |
| Accounts receivables, net | $88,700 | $79,500 |
| Merchandise inventory | $86,800 | $82,000 |
| Prepaid expenses | $9,700 | $10,100 |
| Current assets (A) | $205,200 | $208,100 |
| Current liabilities (B) | $90,500 | $97,000 |
| Current ratio | 2.3:1 | 2.1:1 |
Table (1)
Therefore, the current ratio of Company F and Company B is 2.3 to 1 and 2.1 to 1 respectively.
1(b)
Compute the Acid-test ratio ratio of Company F and Company B.
Explanation of Solution
Acid-test ratio: It is a ratio used to determine a company’s ability to pay back its current liabilities by liquid assets that are current assets except inventory and prepaid expenses.
Compute the Acid-test ratio of Company F and Company B:
| Particulars | Company F | Company B |
| Cash | $20,000 | $36,500 |
| Accounts receivables, net | $77,100 | $70,500 |
| Current notes receivable (trade) | $11,600 | $9,000 |
| Quick assets (C) | $108,700 | $116,000 |
| Current liabilities (D) | $90,500 | $97,000 |
| Acid-test ratio | 1.2:1 | 1.2:1 |
Table (2)
Therefore, the Acid-test ratio of Company F and Company B is 1.2 to 1 and 1.2 to 1 respectively.
1(c)
Compute the accounts receivable turnover ratio of Company F and Company B.
Explanation of Solution
Accounts receivables turnover ratio: Receivables turnover ratio is mainly used to evaluate the collection process efficiency. It helps the company to know the number of times the accounts receivable is collected in a particular time period. This ratio is determined by dividing credit sales and average net receivables.
Compute the accounts receivable turnover ratio of Company F and Company B:
| Particulars | Company F | Company B |
| Beginning Accounts receivables, net (E) | $72,200 | $73,300 |
| Ending Accounts receivables, net (F) | $88,700 | $79,500 |
| Average accounts receivables | $80,450 | $76,400 |
| Net credit sales (H) | $393,600 | $667,500 |
| Accounts receivable turnover ratio | 4.9 times | 8.7 times |
Table (3)
Therefore, the accounts receivable turnover ratio of Company F and Company B is 4.9 to 1 and 8.7 to 1 respectively.
1(d)
Compute the Inventory turnover ratio of Company F and Company B.
Explanation of Solution
Inventory Turnover Ratio: This ratio is a financial metric used by a company to quantify the number of times inventory is used or sold during the accounting period. It is calculated by using the formula:
Compute the Inventory turnover ratio of Company F and Company B:
| Particulars | Company F | Company B |
| Ending inventory (I) | $86,800 | $82,000 |
| Beginning inventory (J) | $105,100 | $80,500 |
| Average inventory (K) | $95,950 | $81,250 |
| Cost of goods sold (L) | $290,600 | $480,000 |
| Inventory turnover ratio | 3.0 times | 5.9 times |
Table (4)
Therefore, the Inventory turnover ratio of Company F and Company B is 3.0 to 1 and 5.9 to 1 respectively.
1(e)
Compute the days’ sales in inventory of Company F and Company B.
Explanation of Solution
Days’ sales in inventory: Days’ in inventory is determined as the number of days a particular company takes to make sales of the inventory available with them.
Compute the days’ sales in inventory of Company F and Company B:
| Particulars | Company F | Company B |
| Ending inventory (M) | $86,800 | $82,000 |
| Cost of goods sold (N) | $290,600 | $480,000 |
| Days’ sales in inventory | 109.0 days | 62.4 days |
Table (5)
Therefore, the days’ sales in Inventory of Company F and Company B are 109 days and 62.4 days respectively.
1(f)
Compute the days’ sales uncollected of Company F and Company B.
Explanation of Solution
Days’ sales uncollected: This ratio is used to determine the number of days a particular company takes to collect accounts receivables.
Compute the days’ sales uncollected of Company F and Company B:
| Particulars | Company F | Company B |
| Ending Accounts receivables, net (F) | $88,700 | $79,500 |
| Net credit sales (O) | $393,600 | $667,500 |
| Days’ sales uncollected | 82.3 days | 43.5 days |
Table (6)
Therefore, the days’ sales uncollected of Company F and Company B are 82.3 days and 43.5 days respectively.
Identify the company with better short-term credit risk and explain the same.
Explanation of Solution
The current ratio of Company F is slightly better than the current ratio of Company B. The acid-test ratios of both the companies are same. The accounts turnover and the inventory turnover of Company B are better than the ratios of Company F. Hence, Company B is better in managing the short term credit risk.
2(a)
Compute the profit margin ratio of Company F and Company B.
Explanation of Solution
Profit margin: It is one of the profitability ratios. Profit margin ratio is used to measure the percentage of net income that is being generated per dollar of revenue or sales.
Given, net income and net sales of Company F are $33,850 and $393,600.
Compute the profit margin ratio of Company F:
Given, net income and net sales of Company B are $61,700 and $667,500.
Compute the profit margin ratio of Company B:
Therefore, the profit margin of Company F and Company B is 8.6% and 9.2% respectively.
2(b)
Compute the total asset turnover of Company F and Company B.
Explanation of Solution
Total asset turnover: Total asset turnover is a ratio that measures the productive capacity of the total assets to generate the sales revenue for the company. Thus, it shows the relationship between the net sales and the average total assets. Turnover of assets is calculated as follows:
Given, average total assets and net sales of Company F are $382,750 (1) and $393,600.
Compute the total assets turnover ratio of Company F:
Given, average total assets and net sales of Company B are $451,700 (1) and $667,500.
Compute the total assets turnover ratio of Company B:
Working note:
Compute the average total assets of Company F and Company B:
| Ratios and Formula | Company F | Company B |
|
Average total assets: |
…… (1)
Table (7)
Therefore, the total assets turnover of Company F and Company B is 1.03 times and 1.48 times respectively.
2(c)
Compute the return on total assets of Company F and Company B.
Explanation of Solution
Return on total assets: Return on total assets is the financial ratio that determines the amount of net income earned by the business with the use of total assets owned by it. It indicates the magnitude of the company’s earnings with relative to its total assets. Return on investment is calculated as follows:
Given, average total assets and net income of Company F are $382,750 (1) and $33,850.
Compute the return on total assets ratio of Company F:
Given, average total assets and net income of Company B are $451,700 (1) and $61,700.
Compute the return on total assets ratio of Company B:
Therefore, the total assets turnover of Company F and Company B is 8.8% and 13.7% respectively.
2(d)
Compute the return on common stockholders’ equity of Company F and Company B.
Explanation of Solution
Return on common stockholders’ equity ratio: It is a profitability ratio that measures the profit generating ability of the company from the invested money of the shareholders. The formula to calculate the return on equity is as follows:
Given, average Common stockholders’ equity and net income of Company F are $190,350 (2) and $33,850.
Compute the return on common stockholders’ equity of Company F:
Given, average Common stockholders’ equity and net income of Company B are $260,400 (2) and $61,700.
Compute the return on common stockholders’ equity of Company B:
Working note:
Compute the average Common stockholders’ equity of Company F and Company B:
| Ratios and Formula | Company F | Company B |
|
Average common stockholders’ equity: |
…… (2)
Table (8)
Therefore, the common stockholders’ equity of Company F and Company B is 17.8% and 23.7% respectively.
2(e)
Compute the price/earnings ratio of Company F and Company B.
Explanation of Solution
Price/Earnings Ratio: The price/earnings ratio shows the market value of the amount invested to earn $1 by a company. It is major tool used by investors for making decisions related to the investment in a company.
Given, market price per share of company F is $25 and earnings per share is $1.27.
Compute the price/earnings ratio of Company F:
Given, market price per share of company B is $25 and earnings per share is $2.19.
Compute the price/earnings ratio of Company B:
Therefore, the price/earnings ratio of Company F and Company B is 19.7 and 11.4 respectively.
2(f)
Compute the dividend yield ratio of Company F and Company B.
Explanation of Solution
Dividend yields: Dividend yield ratio indicates how much percentage of share prices a company pays out in the form of dividends price. The formula to calculate the dividend yield percentage is as follows:
Given, market price per share of company B is $25 and annual dividend per share is $1.50.
Compute the dividend yield ratio of Company F:
Given, market price per share of company B is $25 and annual dividend per share is $1.50.
Compute the dividend yield ratio of Company B:
Therefore, the dividend yield ratio of Company F and Company B is 6.0% and 6.0% respectively.
Identify the company, that its stock would be recommended as the better investment and explain the same.
Explanation of Solution
The price earnings ratio of Company F is slightly better than the price earnings ratio of Company B. The dividend yield ratios of both the companies are same. The profitability ratios of Company B are better than the ratios of Company F. Hence, Hence, Company B is a better investment option.
Want to see more full solutions like this?
Chapter 17 Solutions
Principles of Financial Accounting, Chapters 1-17 - With Access (Looseleaf)


- General Accounting Question please answerarrow_forwardIncorrect Question 6 0 / 10 pts Audit Organization ABC is evaluating the different non-audit services it provides to its various clients. Indicate which of the following non-audit services would impair its independence. There are multiple answers. (Hint: There are five non-audit services that would impair the firm's independence). Hiring or terminating the audited entity's employees. Preparing financial statements in their entirety from a client-provided trial balance. Evaluation of an entity's system of internal control performed outside the audit. Approving entity transactions. Supervising ongoing monitoring procedures over an entity's system of internal control. Preparing certain line items or sections of the financial statements based on information in the trial balance. Preparing account reconciliations that identify reconciling items for the audited entity management's evaluation. Changing journal entries without management approval. Posting coded transactions to an audited…arrow_forwardFinancial Accountingarrow_forward
- Can you please solve this general accounting question?arrow_forwardThe Spice Saga has two production departments, Assembly and Finishing. Each department calculates its own predetermined overhead rate and applies manufacturing overhead throughout the year. The following information was used to calculate overhead application rates: Assembly Finishing TotalEstimated overhead $ 800,000 $ 420,000 $ 1,220,000Direct labor hours 50,000 30,000 80,000Machine hours 16,000 8,000 24,000Overhead information for Job #687 is as follows: Assembly Finishing TotalDirect labor hours 100 125 225Machine hours 30 18 48 a. Assume that The Spice Saga uses direct labor hours to apply overhead in both production departments How much overhead will be applied to Job #687? Note: Round your answer to 2 decimals.b. Assume that The Spice Saga uses machine hours to apply…arrow_forwardGeneral Accountingarrow_forward
 Principles of Accounting Volume 1AccountingISBN:9781947172685Author:OpenStaxPublisher:OpenStax College
 Financial Accounting: The Impact on Decision Make...AccountingISBN:9781305654174Author:Gary A. Porter, Curtis L. NortonPublisher:Cengage Learning
 Cornerstones of Financial AccountingAccountingISBN:9781337690881Author:Jay Rich, Jeff JonesPublisher:Cengage Learning