Concept explainers
Correcting a Prediction The financial analysts at the store in Example 5 corrected their projections and are now expecting the total sales for the
day of January to be
thousand dollars.
a. Let
be as in Example 5. Compute
and
b. Compare and interpret the data in part (a) as they pertain to the sales on January
Example 5:
Declining Sales:
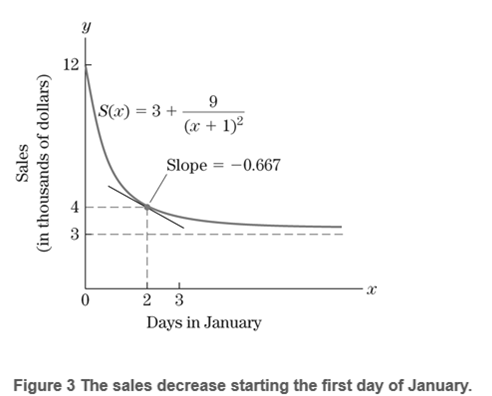
At the end of holiday season in January, the sales at a department store are expected to fall (Fig. 3). It is estimated that for the
day of January the sales will be
thousand dollars.
a. Compute
b. Estimate the value of sale on January
and compare your result with the exact value
Solution:
a. We have,
thousand dollars.

To compute
as
The equation
and
the sales are
and are falling at the rate of
b. To estimate
Thus, our estimate of the sales on January
from the formula:
This is close to our estimate of
Want to see the full answer?
Check out a sample textbook solution
Chapter 1 Solutions
Calculus & Its Applications (14th Edition)
- 3. We'd like to know the first time when the population reaches 7000 people. First, graph the function from part (a) on your calculator or Desmos. In the same window, graph the line y = 7000. Notice that you will need to adjust your window so that you can see values as big as 7000! Investigate the intersection of the two graphs. (This video shows you how to find the intersection on your calculator, or in Desmos just hover the cursor over the point.) At what value t> 0 does the line intersect with your exponential function? Round your answer to two decimal places. (You don't need to show work for this part.) (2 points)arrow_forwardSuppose the planet of Tattooine currently has a population of 6500 people and an annual growth rate of 0.35%. Use this information for all the problems below. 1. Find an exponential function f(t) that gives the population of Tattooine t years from now. (3 points)arrow_forwardA house was valued at $95,000 in the year 1988. The value appreciated to $170,000 by the year 2007. A) If the value is growing exponentially, what was the annual growth rate between 1988 and 2007? Round the growth rate to 4 decimal places. r = B) What is the correct answer to part A written in percentage form? r = 3 %.arrow_forward
- B G R + K Match each equation with a graph above - 3(0.9)* 1 a. green (G) 3(1.5)* b. black (K) 3(0.73)* c. blue (B) d. red (R) I ✪ 4(1.21)* - 3(1.21)* e. orange (O)arrow_forwardSuppose the planet of Tattooine currently has a population of 6500 people and an annual growth rate of 0.35%. Use this information for all the problems below.arrow_forwardTwo cables tied together at C are loaded as shown. Given: Q = 130 lb. 8 30° C B Q 3 4 Draw the free-body diagram needed to determine the range of values of P for which both cables remain taut.arrow_forward
- Cable AB is 103 ft long and the tension in the cable is 3900 lb. 56 ft A 50° 20° B x C Identify the angles 0.0, and 8, that define the direction of force. 1 By N 2 Match each of the options above to the items below. 142.1° 57.1° 73.3° 3 8.arrow_forwardIn the given figure, P = 51 lb . 65° C 25° 35° 75 lb P Determine the corresponding magnitude of the resultant. The corresponding magnitude of the resultant is| lb.arrow_forwardCable AB is 103 ft long and the tension in the cable is 3900 lb. 56 ft D y A B 20° 50° x C Identify the x, y, and z components of the force exerted by the cable on the anchor B. 1 F. FI 3 Fy 2 Match each of the options above to the items below. 2,120 lb 1,120 lb -3,076 lbarrow_forward
- In the given figure, P = 51 lb. 65° 25° 35° 75 lb P B Determine the required tension in cable AC, knowing that the resultant of the three forces exerted at point C of boom BC must be directed along BC. The required tension in cable AC is lb.arrow_forwardhelp on this question about Laplace transformation?arrow_forwardHelp me expand this fraction below.arrow_forward
 Glencoe Algebra 1, Student Edition, 9780079039897...AlgebraISBN:9780079039897Author:CarterPublisher:McGraw Hill
 Functions and Change: A Modeling Approach to Coll...AlgebraISBN:9781337111348Author:Bruce Crauder, Benny Evans, Alan NoellPublisher:Cengage Learning
 Trigonometry (MindTap Course List)TrigonometryISBN:9781337278461Author:Ron LarsonPublisher:Cengage LearningAlgebra & Trigonometry with Analytic GeometryAlgebraISBN:9781133382119Author:SwokowskiPublisher:Cengage
 Big Ideas Math A Bridge To Success Algebra 1: Stu...AlgebraISBN:9781680331141Author:HOUGHTON MIFFLIN HARCOURTPublisher:Houghton Mifflin Harcourt


