
Bundle: Modern Business Statistics with Microsoft Office Excel, Loose-Leaf Version, 6th + MindTap Business Statistics, 2 terms (12 months) Printed Access Card
6th Edition
ISBN: 9781337589383
Author: David R. Anderson, Dennis J. Sweeney, Thomas A. Williams, Jeffrey D. Camm, James J. Cochran
Publisher: Cengage Learning
expand_more
expand_more
format_list_bulleted
Videos
Textbook Question
Chapter 17, Problem 43SE
United Dairies, Inc., supplies milk to several independent grocers throughout Dade County, Florida. Managers at United Dairies want to develop a forecast of the number of half-gallons of milk sold per week. Sales data for the past 12 weeks follow.
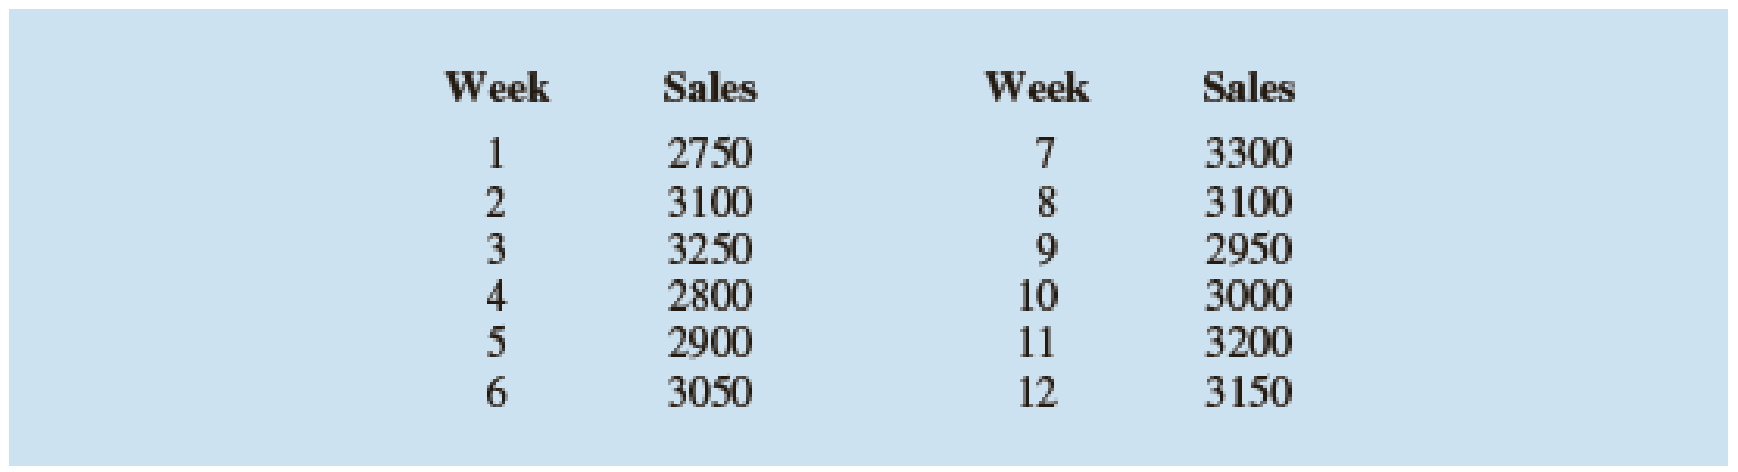
- a. Construct a time series plot. What type of pattern exists in the data?
- b. Use exponential smoothing with α = .4 to develop a forecast of demand for week 13.
Expert Solution & Answer

Trending nowThis is a popular solution!

Students have asked these similar questions
9. The concentration function of a random variable X is defined as
Qx(h) = sup P(x ≤ X ≤x+h), h>0.
x
(a) Show that Qx+b (h) = Qx(h).
(b) Is it true that Qx(ah) =aQx(h)?
(c) Show that, if X and Y are independent random variables, then
Qx+y (h) min{Qx(h). Qy (h)).
To put the concept in perspective, if X1, X2, X, are independent, identically
distributed random variables, and S₁ = Z=1Xk, then there exists an absolute
constant, A, such that
A
Qs, (h) ≤
√n
Some references: [79, 80, 162, 222], and [204], Sect. 1.5.
29
Suppose that a mound-shaped data set has a
must mean of 10 and standard deviation of 2.
a. About what percentage of the data should
lie between 6 and 12?
b. About what percentage of the data should
lie between 4 and 6?
c. About what percentage of the data should
lie below 4?
91002 175/1
3
2,3,
ample
and
rical
t?
the
28 Suppose that a mound-shaped data set has a
mean of 10 and standard deviation of 2.
a. About what percentage of the data should
lie between 8 and 12?
b. About what percentage of the data should
lie above 10?
c. About what percentage of the data should
lie above 12?
Chapter 17 Solutions
Bundle: Modern Business Statistics with Microsoft Office Excel, Loose-Leaf Version, 6th + MindTap Business Statistics, 2 terms (12 months) Printed Access Card
Ch. 17.2 - 1. Consider the following time series...Ch. 17.2 - 2. Refer to the time series data in exercise 1....Ch. 17.2 - Prob. 3ECh. 17.2 - 4. Consider the following time series...Ch. 17.3 - Consider the following time series...Ch. 17.3 - Consider the following time series...Ch. 17.3 - Refer to the gasoline sales time series data in...Ch. 17.3 - Prob. 8ECh. 17.3 - 9. With the gasoline time series data from Table...Ch. 17.3 - 10. With a smoothing constant of α = .2, equation...
Ch. 17.3 - For the Hawkins Company, the monthly percentages...Ch. 17.3 - Corporate triple-A bond interest rates for 12...Ch. 17.3 - The values of Alabama building contracts (in $...Ch. 17.3 - The following time series shows the sales of a...Ch. 17.3 - Ten weeks of data on the Commodity Futures Index...Ch. 17.3 - Prob. 16ECh. 17.4 - Consider the following time series...Ch. 17.4 - Prob. 18ECh. 17.4 - Prob. 19ECh. 17.4 - Prob. 20ECh. 17.4 - Prob. 21ECh. 17.4 - Prob. 22ECh. 17.4 - The president of a small manufacturing firm is...Ch. 17.4 - The following data shows the average interest rate...Ch. 17.4 - Quarterly revenue ($ millions) for Twitter for the...Ch. 17.4 - Giovanni Food Products produces and sells frozen...Ch. 17.4 - The number of users of Facebook from 2004 through...Ch. 17.5 - Consider the following time series.
Construct a...Ch. 17.5 - Consider the following time series...Ch. 17.5 - The quarterly sales data (number of copies sold)...Ch. 17.5 - Air pollution control specialists in southern...Ch. 17.5 - South Shore Construction builds permanent docks...Ch. 17.5 - Prob. 33ECh. 17.5 - Prob. 34ECh. 17.6 - Consider the following time series...Ch. 17.6 - Refer to exercise 35.
Deseasonalize the time...Ch. 17.6 - The quarterly sales data (number of copies sold)...Ch. 17.6 - Three years of monthly lawn-maintenance expenses...Ch. 17.6 - Air pollution control specialists in southern...Ch. 17.6 - Electric power consumption is measured in...Ch. 17 - The weekly demand (in cases) for a particular...Ch. 17 - The following table reports the percentage of...Ch. 17 - United Dairies, Inc., supplies milk to several...Ch. 17 - Annual retail store revenue for Apple from 2007 to...Ch. 17 - The Mayfair Department Store in Davenport, Iowa,...Ch. 17 - Prob. 47SECh. 17 - The Costello Music Company has been in business...Ch. 17 - Consider the Costello Music Company problem in...Ch. 17 - Prob. 50SECh. 17 - Refer to the Costello Music Company time series in...Ch. 17 - Prob. 52SECh. 17 - Refer to the Hudson Marine problem in exercise 52....Ch. 17 - Refer to the Hudson Marine problem in exercise...Ch. 17 - Refer to the Hudson Marine data in exercise...Ch. 17 - Forecasting Food and Beverage Sales
The Vintage...Ch. 17 - The Carlson Department Store suffered heavy damage...
Knowledge Booster


Learn more about
Need a deep-dive on the concept behind this application? Look no further. Learn more about this topic, statistics and related others by exploring similar questions and additional content below.Similar questions
- 27 Suppose that you have a data set of 1, 2, 2, 3, 3, 3, 4, 4, 5, and you assume that this sample represents a population. The mean is 3 and g the standard deviation is 1.225.10 a. Explain why you can apply the empirical rule to this data set. b. Where would "most of the values" in the population fall, based on this data set?arrow_forward30 Explain how you can use the empirical rule to find out whether a data set is mound- shaped, using only the values of the data themselves (no histogram available).arrow_forward5. Let X be a positive random variable with finite variance, and let A = (0, 1). Prove that P(X AEX) 2 (1-A)² (EX)² EX2arrow_forward
- 6. Let, for p = (0, 1), and xe R. X be a random variable defined as follows: P(X=-x) = P(X = x)=p. P(X=0)= 1-2p. Show that there is equality in Chebyshev's inequality for X. This means that Chebyshev's inequality, in spite of being rather crude, cannot be improved without additional assumptions.arrow_forward4. Prove that, for any random variable X, the minimum of EIX-al is attained for a = med (X).arrow_forward8. Recall, from Sect. 2.16.4, the likelihood ratio statistic, Ln, which was defined as a product of independent, identically distributed random variables with mean 1 (under the so-called null hypothesis), and the, sometimes more convenient, log-likelihood, log L, which was a sum of independent, identically distributed random variables, which, however, do not have mean log 1 = 0. (a) Verify that the last claim is correct, by proving the more general statement, namely that, if Y is a non-negative random variable with finite mean, then E(log Y) log(EY). (b) Prove that, in fact, there is strict inequality: E(log Y) < log(EY), unless Y is degenerate. (c) Review the proof of Jensen's inequality, Theorem 5.1. Generalize with a glimpse on (b).arrow_forward
- 3. Prove that, for any random variable X, the minimum of E(X - a)² is attained for a = EX. Provedarrow_forward7. Cantelli's inequality. Let X be a random variable with finite variance, o². (a) Prove that, for x ≥ 0, P(X EX2x)≤ 02 x² +0² 202 P(|X - EX2x)<≤ (b) Find X assuming two values where there is equality. (c) When is Cantelli's inequality better than Chebyshev's inequality? (d) Use Cantelli's inequality to show that med (X) - EX ≤ o√√3; recall, from Proposition 6.1, that an application of Chebyshev's inequality yields the bound o√√2. (e) Generalize Cantelli's inequality to moments of order r 1.arrow_forwardThe college hiking club is having a fundraiser to buy new equipment for fall and winter outings. The club is selling Chinese fortune cookies at a price of $2 per cookie. Each cookie contains a piece of paper with a different number written on it. A random drawing will determine which number is the winner of a dinner for two at a local Chinese restaurant. The dinner is valued at $32. Since fortune cookies are donated to the club, we can ignore the cost of the cookies. The club sold 718 cookies before the drawing. Lisa bought 13 cookies. Lisa's expected earnings can be found by multiplying the value of the dinner by the probability that she will win. What are Lisa's expected earnings? Round your answer to the nearest cent.arrow_forward
- The Honolulu Advertiser stated that in Honolulu there was an average of 659 burglaries per 400,000 households in a given year. In the Kohola Drive neighborhood there are 321 homes. Let r be the number of homes that will be burglarized in a year. Use the formula for Poisson distribution. What is the value of p, the probability of success, to four decimal places?arrow_forwardThe college hiking club is having a fundraiser to buy new equipment for fall and winter outings. The club is selling Chinese fortune cookies at a price of $2 per cookie. Each cookie contains a piece of paper with a different number written on it. A random drawing will determine which number is the winner of a dinner for two at a local Chinese restaurant. The dinner is valued at $32. Since fortune cookies are donated to the club, we can ignore the cost of the cookies. The club sold 718 cookies before the drawing. Lisa bought 13 cookies. Lisa's expected earnings can be found by multiplying the value of the dinner by the probability that she will win. What are Lisa's expected earnings? Round your answer to the nearest cent.arrow_forwardWhat was the age distribution of nurses in Great Britain at the time of Florence Nightingale? Thanks to Florence Nightingale and the British census of 1851, we have the following information (based on data from the classic text Notes on Nursing, by Florence Nightingale). Note: In 1851 there were 25,466 nurses in Great Britain. Furthermore, Nightingale made a strict distinction between nurses and domestic servants. Use a histogram and graph the probability distribution. Using the graph of the probability distribution determine the probability that a British nurse selected at random in 1851 would be 40 years of age or older. Round your answer to nearest thousandth. Age range (yr) 20–29 30–39 40–49 50–59 60–69 70–79 80+ Midpoint (x) 24.5 34.5 44.5 54.5 64.5 74.5 84.5 Percent of nurses 5.7% 9.7% 19.5% 29.2% 25.0% 9.1% 1.8%arrow_forward
arrow_back_ios
SEE MORE QUESTIONS
arrow_forward_ios
Recommended textbooks for you
 Glencoe Algebra 1, Student Edition, 9780079039897...AlgebraISBN:9780079039897Author:CarterPublisher:McGraw Hill
 College Algebra (MindTap Course List)AlgebraISBN:9781305652231Author:R. David Gustafson, Jeff HughesPublisher:Cengage Learning
 Functions and Change: A Modeling Approach to Coll...AlgebraISBN:9781337111348Author:Bruce Crauder, Benny Evans, Alan NoellPublisher:Cengage Learning
 Holt Mcdougal Larson Pre-algebra: Student Edition...AlgebraISBN:9780547587776Author:HOLT MCDOUGALPublisher:HOLT MCDOUGAL
 Big Ideas Math A Bridge To Success Algebra 1: Stu...AlgebraISBN:9781680331141Author:HOUGHTON MIFFLIN HARCOURTPublisher:Houghton Mifflin Harcourt
Glencoe Algebra 1, Student Edition, 9780079039897...
Algebra
ISBN:9780079039897
Author:Carter
Publisher:McGraw Hill
College Algebra (MindTap Course List)
Algebra
ISBN:9781305652231
Author:R. David Gustafson, Jeff Hughes
Publisher:Cengage Learning
Functions and Change: A Modeling Approach to Coll...
Algebra
ISBN:9781337111348
Author:Bruce Crauder, Benny Evans, Alan Noell
Publisher:Cengage Learning
Holt Mcdougal Larson Pre-algebra: Student Edition...
Algebra
ISBN:9780547587776
Author:HOLT MCDOUGAL
Publisher:HOLT MCDOUGAL
Big Ideas Math A Bridge To Success Algebra 1: Stu...
Algebra
ISBN:9781680331141
Author:HOUGHTON MIFFLIN HARCOURT
Publisher:Houghton Mifflin Harcourt
Time Series Analysis Theory & Uni-variate Forecasting Techniques; Author: Analytics University;https://www.youtube.com/watch?v=_X5q9FYLGxM;License: Standard YouTube License, CC-BY
Operations management 101: Time-series, forecasting introduction; Author: Brandoz Foltz;https://www.youtube.com/watch?v=EaqZP36ool8;License: Standard YouTube License, CC-BY