
Videos
The weekly demand (in cases) for a particular brand of automatic dishwasher detergent for a chain of grocery stores located in Columbus, Ohio, follows.

- a. Construct a time series plot. What type of pattern exists in the data?
- b. Use a three-week moving average to develop a forecast for week 11.
- c. Use exponential smoothing with a smoothing constant of α = .2 to develop a forecast for week 11.
- d. Which of the two methods do you prefer? Why?
a.
Construct the time series plot.
Explain the type of pattern.
Answer to Problem 41SE
The time series plot is given below:
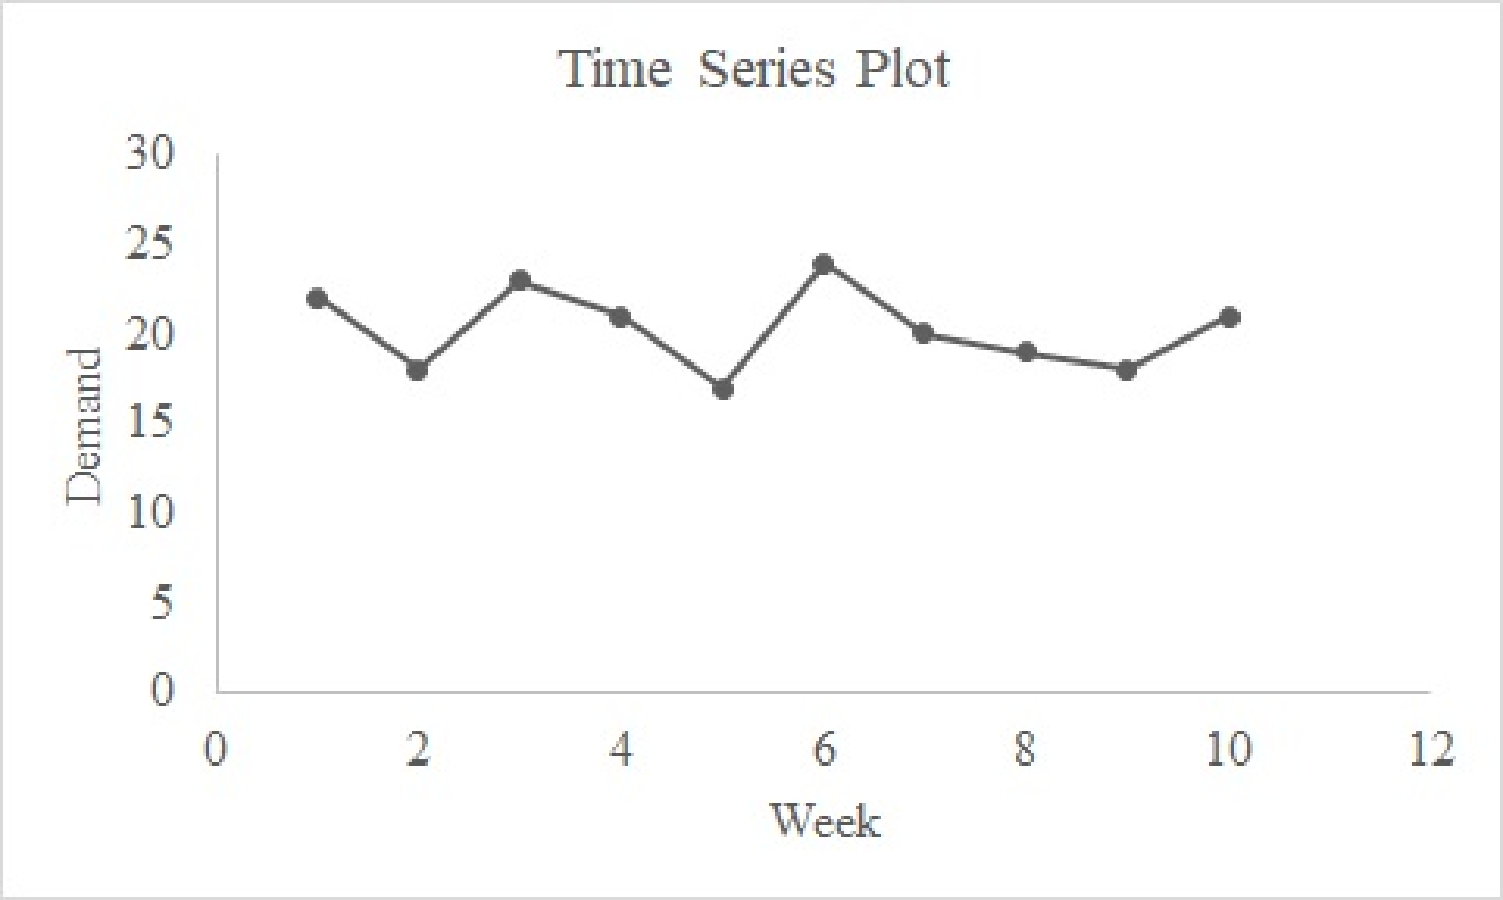
The pattern that appears in the graph is a horizontal pattern.
Explanation of Solution
Calculation:
The given data represent the weekly demand for automatic dishwasher detergent.
Software procedure:
Step-by-step software procedure to draw the time series plot using EXCEL:
- Open an EXCEL file.
- In column A, enter the data of Week, and in column B, enter the corresponding values of Demand.
- Select the data that are to be displayed.
- Click on the Insert Tab > select Scatter icon.
- Choose a Scatter with Straight Lines and Markers.
- Click on the chart > select Layout from the Chart Tools.
- Select Chart Title > Above Chart and enter Time Series Plot.
- Select Axis Title > Primary Horizontal Axis Title > Title Below Axis.
- Enter Week in the dialog box.
- Select Axis Title > Primary Vertical Axis Title > Rotated Title.
- Enter Demand in the dialog box.
From the output, the pattern that appears in the graph is a horizontal pattern.
b.
Calculate the forecast for week 11 using three-week moving averages.
Answer to Problem 41SE
The forecast for week 11 using three-week moving averages is 19.33.
Explanation of Solution
Calculation:
The forecast for week 11 using three-week moving averages is to be obtained.
Software procedure:
Step-by-step procedure to obtain the forecasts using EXCEL:
- In column A, enter the data of Month, and in column B, enter the corresponding values of Demand.
- In Data, select Data Analysis and choose Moving Average.
- In Input Range, select Demand.
- Select Label in First Row.
- In Interval, enter 3.
- In Output Range, select C3.
- Click OK.
Output using the EXCEL software is given below:
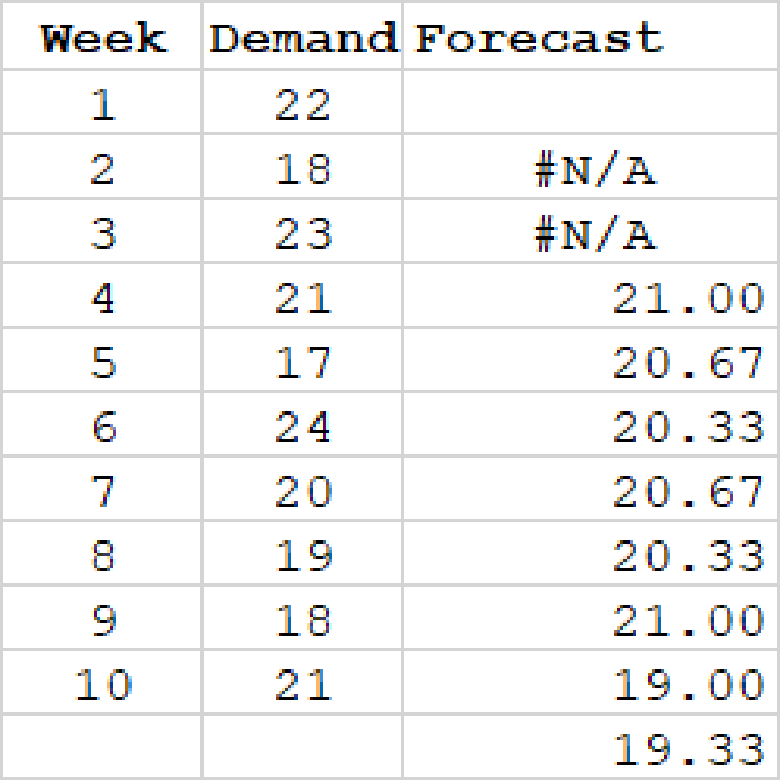
From the output, the forecast value for week 11 is 19.33.
c.
Calculate the forecast for week 11 using the exponential smoothing with constant 0.2.
Answer to Problem 41SE
The forecast for week 11 using the exponential smoothing with constant 0.2 is 20.14.
Explanation of Solution
Calculation:
It is given that
Software procedure:
Step-by-step procedure to obtain the forecasts using EXCEL:
- In column A, enter the data of Week, and in column B, enter the corresponding values of Demand.
- Select Data Analysis and choose Exponential Smoothing.
- In Input Range, select Demand.
- In Damping factor, enter 0.8.
- Select Label in First Row.
- In Output Range, select C2.
- Click OK.
Output using the EXCEL software is given below:
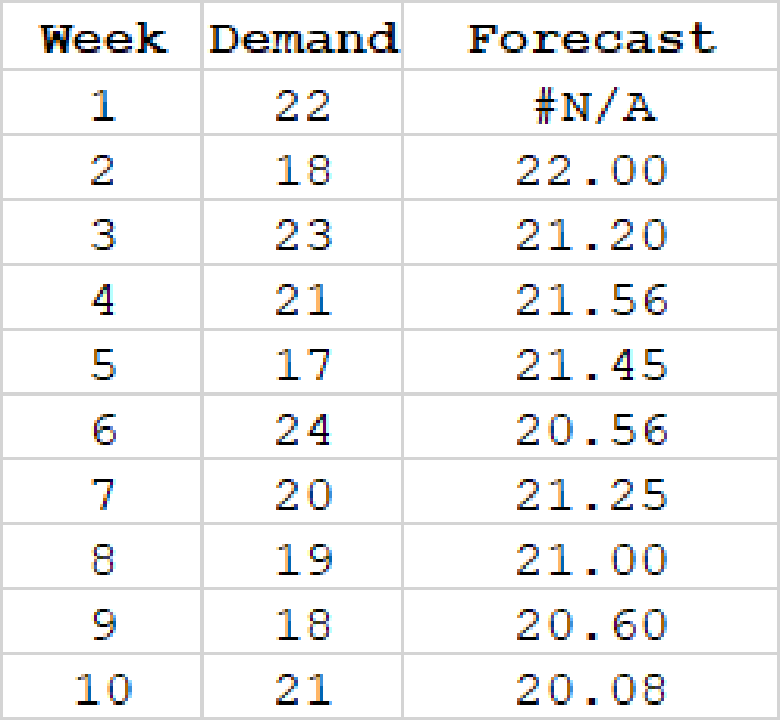
The forecast value for week 11 using exponential smoothing method is obtained as follows:
Here,
Thus, the forecast value for week 11 is 20.26.
d.
Identify the most preferable method between three-week moving averages and exponential smoothing. Explain the reason.
Answer to Problem 41SE
The three-week moving average gives the most accurate forecast because MSE for three-week moving averages is lesser when compared to the MSE for exponential smoothing.
Explanation of Solution
The formula for finding the forecast error2 is as follows:
For Week 3:
The forecast error2 for week 4 for 3-week moving average is obtained as follows:
The remaining forecasts errors2 for exponential smoothing averages are obtained as follows:
| Week | Demand | Forecast (Ft) for 3-Week Moving Average | (Forecast Error)2 | Forecast (Ft) for | (Forecast Error)2 |
| 1 | 7.35 | - | - | - | - |
| 2 | 7.4 | - | - | 22.00 | 16.00 |
| 3 | 7.55 | - | - | 21.20 | 3.24 |
| 4 | 7.56 | 21.00 | 0.00 | 21.56 | 0.31 |
| 5 | 7.6 | 20.67 | 13.44 | 21.45 | 19.78 |
| 6 | 7.52 | 20.33 | 13.44 | 20.56 | 11.84 |
| 7 | 7.52 | 20.67 | 0.44 | 21.25 | 1.55 |
| 8 | 7.7 | 20.33 | 1.78 | 21.00 | 3.99 |
| 9 | 7.62 | 21.00 | 9.00 | 20.60 | 6.75 |
| 10 | 7.55 | 19.00 | 4.00 | 20.08 | 0.85 |
| Total | 42.11 | 64.33 |
The MSE for 3-week moving average is obtained as follows:
Thus, the value of MSE for 3-week moving average is 6.02.
The MSE for exponential smoothing averages for
Thus, the value of MSE for exponential smoothing averages for
Here, it is observed that the MSE for three-week moving averages is lesser when compared to the MSE for exponential smoothing. Thus, the three-week moving average gives the most accurate forecast.
Want to see more full solutions like this?
Chapter 17 Solutions
Modern Business Statistics with Microsoft Excel (MindTap Course List)


- A random sample of medical files is used to estimate the proportion p of all people who have blood type B. If you have no preliminary estimate for p, how many medical files should you include in a random sample in order to be 99% sure that the point estimate will be within a distance of 0.07 from p? Round your answer to the next higher whole number.arrow_forwardA clinical study is designed to assess the average length of hospital stay of patients who underwent surgery. A preliminary study of a random sample of 70 surgery patients’ records showed that the standard deviation of the lengths of stay of all surgery patients is 7.5 days. How large should a sample to estimate the desired mean to within 1 day at 95% confidence? Round your answer to the whole number.arrow_forwardA clinical study is designed to assess the average length of hospital stay of patients who underwent surgery. A preliminary study of a random sample of 70 surgery patients’ records showed that the standard deviation of the lengths of stay of all surgery patients is 7.5 days. How large should a sample to estimate the desired mean to within 1 day at 95% confidence? Round your answer to the whole number.arrow_forward
- In the experiment a sample of subjects is drawn of people who have an elbow surgery. Each of the people included in the sample was interviewed about their health status and measurements were taken before and after surgery. Are the measurements before and after the operation independent or dependent samples?arrow_forwardiid 1. The CLT provides an approximate sampling distribution for the arithmetic average Ỹ of a random sample Y₁, . . ., Yn f(y). The parameters of the approximate sampling distribution depend on the mean and variance of the underlying random variables (i.e., the population mean and variance). The approximation can be written to emphasize this, using the expec- tation and variance of one of the random variables in the sample instead of the parameters μ, 02: YNEY, · (1 (EY,, varyi n For the following population distributions f, write the approximate distribution of the sample mean. (a) Exponential with rate ẞ: f(y) = ß exp{−ßy} 1 (b) Chi-square with degrees of freedom: f(y) = ( 4 ) 2 y = exp { — ½/ } г( (c) Poisson with rate λ: P(Y = y) = exp(-\} > y! y²arrow_forward2. Let Y₁,……., Y be a random sample with common mean μ and common variance σ². Use the CLT to write an expression approximating the CDF P(Ỹ ≤ x) in terms of µ, σ² and n, and the standard normal CDF Fz(·).arrow_forward
- matharrow_forwardCompute the median of the following data. 32, 41, 36, 42, 29, 30, 40, 22, 25, 37arrow_forwardTask Description: Read the following case study and answer the questions that follow. Ella is a 9-year-old third-grade student in an inclusive classroom. She has been diagnosed with Emotional and Behavioural Disorder (EBD). She has been struggling academically and socially due to challenges related to self-regulation, impulsivity, and emotional outbursts. Ella's behaviour includes frequent tantrums, defiance toward authority figures, and difficulty forming positive relationships with peers. Despite her challenges, Ella shows an interest in art and creative activities and demonstrates strong verbal skills when calm. Describe 2 strategies that could be implemented that could help Ella regulate her emotions in class (4 marks) Explain 2 strategies that could improve Ella’s social skills (4 marks) Identify 2 accommodations that could be implemented to support Ella academic progress and provide a rationale for your recommendation.(6 marks) Provide a detailed explanation of 2 ways…arrow_forward
- Question 2: When John started his first job, his first end-of-year salary was $82,500. In the following years, he received salary raises as shown in the following table. Fill the Table: Fill the following table showing his end-of-year salary for each year. I have already provided the end-of-year salaries for the first three years. Calculate the end-of-year salaries for the remaining years using Excel. (If you Excel answer for the top 3 cells is not the same as the one in the following table, your formula / approach is incorrect) (2 points) Geometric Mean of Salary Raises: Calculate the geometric mean of the salary raises using the percentage figures provided in the second column named “% Raise”. (The geometric mean for this calculation should be nearly identical to the arithmetic mean. If your answer deviates significantly from the mean, it's likely incorrect. 2 points) Starting salary % Raise Raise Salary after raise 75000 10% 7500 82500 82500 4% 3300…arrow_forwardI need help with this problem and an explanation of the solution for the image described below. (Statistics: Engineering Probabilities)arrow_forwardI need help with this problem and an explanation of the solution for the image described below. (Statistics: Engineering Probabilities)arrow_forward
 Functions and Change: A Modeling Approach to Coll...AlgebraISBN:9781337111348Author:Bruce Crauder, Benny Evans, Alan NoellPublisher:Cengage Learning
 Glencoe Algebra 1, Student Edition, 9780079039897...AlgebraISBN:9780079039897Author:CarterPublisher:McGraw Hill
 Big Ideas Math A Bridge To Success Algebra 1: Stu...AlgebraISBN:9781680331141Author:HOUGHTON MIFFLIN HARCOURTPublisher:Houghton Mifflin Harcourt
 Algebra and Trigonometry (MindTap Course List)AlgebraISBN:9781305071742Author:James Stewart, Lothar Redlin, Saleem WatsonPublisher:Cengage Learning