Concept explainers
Videos
To review:
The relationship between genotype of patients and concentration as well as
Given:
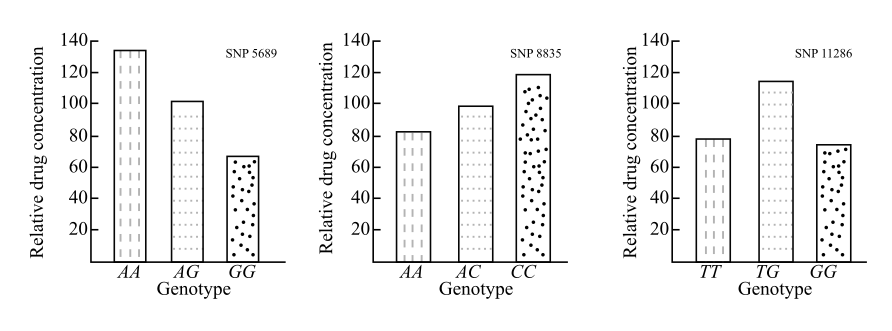
In the given study, the drug calm was administered to people whose SNPs were known and after 12 hours, blood samples were drawn to find the concentration of the drug. The three different SNPs with genotypes are: SNP 5689 (AA, AG, and GG), SNP 8835 (AA, AC, and CC), and SNP 11286 (TT, TG, and GG) as shown in Figure below. The letters (A, T, G, and C) stand for the type of nucleotide on the two homologous chromosomes.
Introduction:
The study of effectiveness of the drug based on information about individual genome or SNPs is called pharmacogenomics. The metabolism of calm depends on the genotype or SNP present in each individual.
Explanation of Solution
SNP 5869: The rate of metabolism and drug concentration after 12 hours of administration is correlated with different genotypes of SNP 5869. The metabolism of the drug is efficient in the people with genotype GG where the drug concentration in the blood is around 70. On the other hand, the drug concentration for the genotype AG is around 100 and it is around 130 for AA genotype. So, the genotype GG of SNP 5869 is associated with metabolizing the drug, calm efficiently.
SNP 8835: The rate of metabolism is high in the case of the genotype AA where the drug concentration is less, which is around 80. On the other hand, the rate of drug metabolism is less in the case of the genotype CC with drug concentration of around 120 and genotype AC where the concentration is around 100. So, the genotype AA of SNP 8835 is associated with metabolizing the drug, calm efficiently.
SNP 11286: The rate of metabolism is efficient for the genotype TT where the drug concentration is around 80. The rate of metabolism is less for the genotypes GG and TG where the drug concentration is 90 and 110, respectively. So, the genotype TT of SNP 11286 is associated with metabolizing the drug, calm efficiently.
Thus, efficiency and rate of drug metabolism depend on the genotypes where drug concentration is inversely proportional to the rate of metabolism.
Want to see more full solutions like this?
Chapter 17 Solutions
LIFE:SCIENCE OF BIOL.(LL) >CUSTOM<


- What did the Cre-lox system used in the Kikuchi et al. 2010 heart regeneration experiment allow researchers to investigate? What was the purpose of the cmlc2 promoter? What is CreER and why was it used in this experiment? If constitutively active Cre was driven by the cmlc2 promoter, rather than an inducible CreER system, what color would you expect new cardiomyocytes in the regenerated area to be no matter what? Why?arrow_forwardWhat kind of organ size regulation is occurring when you graft multiple organs into a mouse and the graft weight stays the same?arrow_forwardWhat is the concept "calories consumed must equal calories burned" in regrads to nutrition?arrow_forward
- You intend to insert patched dominant negative DNA into the left half of the neural tube of a chick. 1) Which side of the neural tube would you put the positive electrode to ensure that the DNA ends up on the left side? 2) What would be the internal (within the embryo) control for this experiment? 3) How can you be sure that the electroporation method itself is not impacting the embryo? 4) What would you do to ensure that the electroporation is working? How can you tell?arrow_forwardDescribe a method to document the diffusion path and gradient of Sonic Hedgehog through the chicken embryo. If modifying the protein, what is one thing you have to consider in regards to maintaining the protein’s function?arrow_forwardThe following table is from Kumar et. al. Highly Selective Dopamine D3 Receptor (DR) Antagonists and Partial Agonists Based on Eticlopride and the D3R Crystal Structure: New Leads for Opioid Dependence Treatment. J. Med Chem 2016.arrow_forward
- The following figure is from Caterina et al. The capsaicin receptor: a heat activated ion channel in the pain pathway. Nature, 1997. Black boxes indicate capsaicin, white circles indicate resinferatoxin. You are a chef in a fancy new science-themed restaurant. You have a recipe that calls for 1 teaspoon of resinferatoxin, but you feel uncomfortable serving foods with "toxins" in them. How much capsaicin could you substitute instead?arrow_forwardWhat protein is necessary for packaging acetylcholine into synaptic vesicles?arrow_forward1. Match each vocabulary term to its best descriptor A. affinity B. efficacy C. inert D. mimic E. how drugs move through body F. how drugs bind Kd Bmax Agonist Antagonist Pharmacokinetics Pharmacodynamicsarrow_forward
- 50 mg dose of a drug is given orally to a patient. The bioavailability of the drug is 0.2. What is the volume of distribution of the drug if the plasma concentration is 1 mg/L? Be sure to provide units.arrow_forwardDetermine Kd and Bmax from the following Scatchard plot. Make sure to include units.arrow_forwardChoose a catecholamine neurotransmitter and describe/draw the components of the synapse important for its signaling including synthesis, packaging into vesicles, receptors, transporters/degradative enzymes. Describe 2 drugs that can act on this system.arrow_forward

 Biology Today and Tomorrow without Physiology (Mi...BiologyISBN:9781305117396Author:Cecie Starr, Christine Evers, Lisa StarrPublisher:Cengage Learning
 Human Heredity: Principles and Issues (MindTap Co...BiologyISBN:9781305251052Author:Michael CummingsPublisher:Cengage Learning
 Concepts of BiologyBiologyISBN:9781938168116Author:Samantha Fowler, Rebecca Roush, James WisePublisher:OpenStax College