
Videos
a.
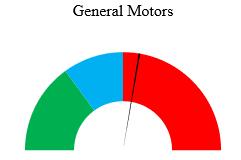
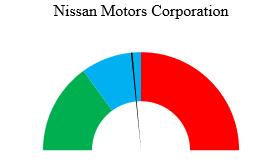
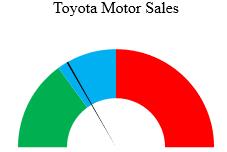
Create a gauge for each automaker.
a.
Explanation of Solution
The gauge for each automaker can be made using the Excel software.
Software Procedure:
Enter the data in Excel using following steps:
Open Excel sheet and name column A as Complaint (A1) and column B as Gauge (B1).
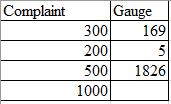
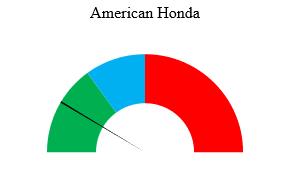
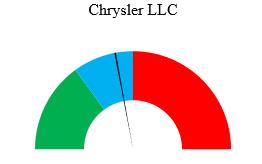
Enter 300, 200 and 500 in the cells A2:A4 (complaint levels-low, medium and high) and 1000 in A5 (sum of all entries in the column).
Under the gauge column, enter 169 (number of complaints received by American Honda) in B2, 5 (width of the pointer of the gauge) in B3, and enter the formula,
The constructed table in excel looks as follows:
Procedure to construct Gauge:
Select both the columns together.
Go to Insert > Charts > All Charts > Combo > Create Custom Combo Chart…
Change the first Chart type to Doughnut and second Chart type to Pie.
Check the secondary axis box for Pie and keep the secondary axis box for doughnut unchecked.
Click on OK.
Click on graph and go to Format and select Series “gauge� from the drop-down box in the Current Selection area.
Click on Format Selection in the Current Selection area.
In the Format Data Series area, change the ‘Angle of first slice’ of the secondary Axis to
Use Ctrl plus the right arrow key to move to each section of the pie.
Go to the Series ‘gauge’ Point 1 using the above method.
Click on Fill & Line option in the Format Data Series area.
Under the Fill list, select no fill.
Do the same above three steps to select solid fill (Black color) for Series ‘gauge’ Point 2 and no fill for Series ‘gauge’ Point 3.
From the drop-down box in the Current Selection area change Series “gauge� to Series ‘Complaint’.
Click on Format Selection in the Current Selection area.
In the Format Data Series area, change the ‘Angle of first slice’ of the secondary Axis to
Use Ctrl plus the right arrow key to move to each section of the doughnut.
Go to the Series ‘Complaint’ Point 1 using the above method.
Click on Fill & Line option in the Format Data Series area.
Under the Fill list, select solid fill and choose a green color.
Perform the same above three steps to select solid fill (blue color) for Series ‘Complaint’ Point 2, solid fill (red color) for Series ‘Complaint’ Point 3 and no fill for Series ‘Complaint’ Point 4.
Delete legends from the pie chart.
Rename the chart title as per the company.
Now, replace the number of complaints received by individual automakers to obtain the respective gauge one by one.
From the above procedure, the obtained gauge for each automaker are as follows:
b.
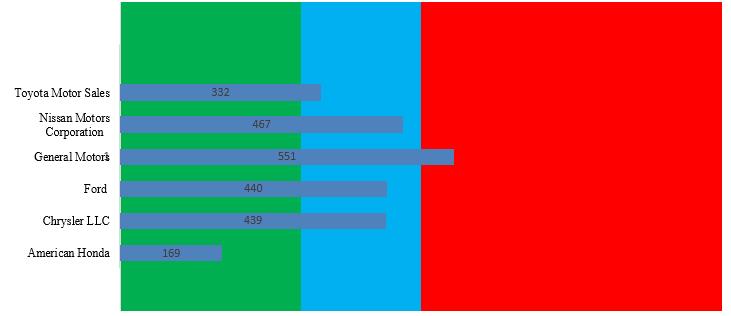
Construct the bullet graph for the automakers.
b.
Explanation of Solution
The bullet graph for the automakers can be created using the Excel software.
Software procedure:
Step by step procedure to create the required bullet graph is as follows:
Enter the given data in Excel and select the data.
Select Insert, then the bar chart icon, and select first 2-D Bar gallery item (Clustered bar).
In the newly constructed bar chart, click on plus sign and uncheck Gridlines.
Right click in the whitespace to the right of chart title and click Format chart area in the shortcut menu.
In the fill part of format chart area pane select No fill.
In the cell
Select Insert, then the bar chart icon, and select second 2-D bar gallery item (Stacked bar).
In the newly constructed bar chart, click on plus sign and uncheck every box.
Right click in the white space to the right of chart title area and click on Select Data in the shortcut menu.
In the data Select Source Dialog box, click Switch Row/Column and then click on OK.
Right click one stacked bar and then click on Format Data Series. In the series option part, change the gap width to
Adjust the size of chart and right click the chart border and select Send to Back > Send to Back in the shortcut menu.
Drag the bar chart with transparent background over the stacked bar chart, such that both charts coincide.
The obtained bullet graph in Excel is as shown below:
c.
Mention the display that is more effective at comparing the number of complaints received by each automaker.
c.
Explanation of Solution
The bullet graph displays the data in a single graph, while gauges should be plotted for each automaker separately. Thus, the bullet graph is a more efficient way to display the data as it requires less space than the gauges. Moreover, the bullet graph also provides the ease of comparing the data at the same time.
Want to see more full solutions like this?
Chapter 17 Solutions
Student Solutions Manual for Basic Business Statistics


- Table of hours of television watched per week: 11 15 24 34 36 22 20 30 12 32 24 36 42 36 42 26 37 39 48 35 26 29 27 81276 40 54 47 KARKE 31 35 42 75 35 46 36 42 65 28 54 65 28 23 28 23669 34 43 35 36 16 19 19 28212 Using the data above, construct a frequency table according the following classes: Number of Hours Frequency Relative Frequency 10-19 20-29 |30-39 40-49 50-59 60-69 70-79 80-89 From the frequency table above, find a) the lower class limits b) the upper class limits c) the class width d) the class boundaries Statistics 300 Frequency Tables and Pictures of Data, page 2 Using your frequency table, construct a frequency and a relative frequency histogram labeling both axes.arrow_forwardA study was undertaken to compare respiratory responses of hypnotized and unhypnotized subjects. The following data represent total ventilation measured in liters of air per minute per square meter of body area for two independent (and randomly chosen) samples. Analyze these data using the appropriate non-parametric hypothesis test. Unhypnotized: 5.0 5.3 5.3 5.4 5.9 6.2 6.6 6.7 Hypnotized: 5.8 5.9 6.2 6.6 6.7 6.1 7.3 7.4arrow_forwardThe class will include a data exercise where students will be introduced to publicly available data sources. Students will gain experience in manipulating data from the web and applying it to understanding the economic and demographic conditions of regions in the U.S. Regions and topics of focus will be determined (by the student with instructor approval) prior to April. What data exercise can I do to fulfill this requirement? Please explain.arrow_forward
- Consider the ceocomp dataset of compensation information for the CEO’s of 100 U.S. companies. We wish to fit aregression model to assess the relationship between CEO compensation in thousands of dollars (includes salary andbonus, but not stock gains) and the following variates:AGE: The CEOs age, in yearsEDUCATN: The CEO’s education level (1 = no college degree; 2 = college/undergrad. degree; 3 = grad. degree)BACKGRD: Background type(1= banking/financial; 2 = sales/marketing; 3 = technical; 4 = legal; 5 = other)TENURE: Number of years employed by the firmEXPER: Number of years as the firm CEOSALES: Sales revenues, in millions of dollarsVAL: Market value of the CEO's stock, in natural logarithm unitsPCNTOWN: Percentage of firm's market value owned by the CEOPROF: Profits of the firm, before taxes, in millions of dollars1) Create a scatterplot matrix for this dataset. Briefly comment on the observed relationships between compensationand the other variates.Note that companies with negative…arrow_forward6 (Model Selection, Estimation and Prediction of GARCH) Consider the daily returns rt of General Electric Company stock (ticker: "GE") from "2021-01-01" to "2024-03-31", comprising a total of 813 daily returns. Using the "fGarch" package of R, outputs of fitting three GARCH models to the returns are given at the end of this question. Model 1 ARCH (1) with standard normal innovations; Model 2 Model 3 GARCH (1, 1) with Student-t innovations; GARCH (2, 2) with Student-t innovations; Based on the outputs, answer the following questions. (a) What can be inferred from the Standardized Residual Tests conducted on Model 1? (b) Which model do you recommend for prediction between Model 2 and Model 3? Why? (c) Write down the fitted model for the model that you recommended in Part (b). (d) Using the model recommended in Part (b), predict the conditional volatility in the next trading day, specifically trading day 814.arrow_forward4 (MLE of ARCH) Suppose rt follows ARCH(2) with E(rt) = 0, rt = ut, ut = στει, σε where {+} is a sequence of independent and identically distributed (iid) standard normal random variables. With observations r₁,...,, write down the log-likelihood function for the model esti- mation.arrow_forward
- 5 (Moments of GARCH) For the GARCH(2,2) model rt = 0.2+0.25u1+0.05u-2 +0.30% / -1 +0.20% -2, find cov(rt). 0.0035 ut, ut = στει,στ =arrow_forwardDefinition of null hypothesis from the textbook Definition of alternative hypothesis from the textbook Imagine this: you suspect your beloved Chicken McNugget is shrinking. Inflation is hitting everything else, so why not the humble nugget too, right? But your sibling thinks you’re just being dramatic—maybe you’re just extra hungry today. Determined to prove them wrong, you take matters (and nuggets) into your own hands. You march into McDonald’s, get two 20-piece boxes, and head home like a scientist on a mission. Now, before you start weighing each nugget like they’re precious gold nuggets, let’s talk hypotheses. The average weight of nuggets as mentioned on the box is 16 g each. Develop your null and alternative hypotheses separately. Next, you weigh each nugget with the precision of a jeweler and find they average out to 15.5 grams. You also conduct a statistical analysis, and the p-value turns out to be 0.01. Based on this information, answer the following questions. (Remember,…arrow_forwardBusiness Discussarrow_forward
- Cape Fear Community Colle X ALEKS ALEKS - Dorothy Smith - Sec X www-awu.aleks.com/alekscgi/x/Isl.exe/10_u-IgNslkr7j8P3jH-IQ1w4xc5zw7yX8A9Q43nt5P1XWJWARE... Section 7.1,7.2,7.3 HW 三 Question 21 of 28 (1 point) | Question Attempt: 5 of Unlimited The proportion of phones that have more than 47 apps is 0.8783 Part: 1 / 2 Part 2 of 2 (b) Find the 70th The 70th percentile of the number of apps. Round the answer to two decimal places. percentile of the number of apps is Try again Skip Part Recheck Save 2025 Mcarrow_forwardHi, I need to sort out where I went wrong. So, please us the data attached and run four separate regressions, each using the Recruiters rating as the dependent variable and GMAT, Accept Rate, Salary, and Enrollment, respectively, as a single independent variable. Interpret this equation. Round your answers to four decimal places, if necessary. If your answer is negative number, enter "minus" sign. Equation for GMAT: Ŷ = _______ + _______ GMAT Equation for Accept Rate: Ŷ = _______ + _______ Accept Rate Equation for Salary: Ŷ = _______ + _______ Salary Equation for Enrollment: Ŷ = _______ + _______ Enrollmentarrow_forwardQuestion 21 of 28 (1 point) | Question Attempt: 5 of Unlimited Dorothy ✔ ✓ 12 ✓ 13 ✓ 14 ✓ 15 ✓ 16 ✓ 17 ✓ 18 ✓ 19 ✓ 20 = 21 22 > How many apps? According to a website, the mean number of apps on a smartphone in the United States is 82. Assume the number of apps is normally distributed with mean 82 and standard deviation 30. Part 1 of 2 (a) What proportion of phones have more than 47 apps? Round the answer to four decimal places. The proportion of phones that have more than 47 apps is 0.8783 Part: 1/2 Try again kip Part ی E Recheck == == @ W D 80 F3 151 E R C レ Q FA 975 % T B F5 10 の 000 园 Save For Later Submit Assignment © 2025 McGraw Hill LLC. All Rights Reserved. Terms of Use | Privacy Center | Accessibility Y V& U H J N * 8 M I K O V F10 P = F11 F12 . darrow_forward
 Glencoe Algebra 1, Student Edition, 9780079039897...AlgebraISBN:9780079039897Author:CarterPublisher:McGraw Hill
 Big Ideas Math A Bridge To Success Algebra 1: Stu...AlgebraISBN:9781680331141Author:HOUGHTON MIFFLIN HARCOURTPublisher:Houghton Mifflin Harcourt
 Holt Mcdougal Larson Pre-algebra: Student Edition...AlgebraISBN:9780547587776Author:HOLT MCDOUGALPublisher:HOLT MCDOUGAL
 Functions and Change: A Modeling Approach to Coll...AlgebraISBN:9781337111348Author:Bruce Crauder, Benny Evans, Alan NoellPublisher:Cengage Learning