
Concept explainers
(a)
To plot:
Grain size distribution curve.
Answer to Problem 19P
Explanation of Solution
Given information:
| Sieve No. | Sieve No. | Percent finer |
| | | |
| | | |
| | | |
| | | |
| | | |
| | | |
| | | |
| | | |
| Pan | Pan | -- |
Concept used:
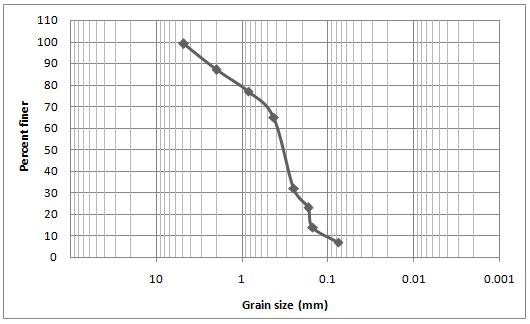
Plot the grain size distribution curve between the sieve number (mm) and the percent finer. The sieve number (mm) is plotted in x -axis and percent finer in y -axis.
Calculation:

Conclusion:
The grain distribution curve is plotted.
(b)
The values of
Answer to Problem 19P
Explanation of Solution
Given information:
| Sieve No. | Sieve No. | Percent finer |
| | | |
| | | |
| | | |
| | | |
| | | |
| | | |
| | | |
| | | |
| Pan | Pan | -- |
Concept used:
Plot the grain size distribution curve between the sieve number (mm) and the percent finer. The sieve number (mm) is plotted in x -axis and percent finer in y -axis. Then the corresponding values of
Calculation:
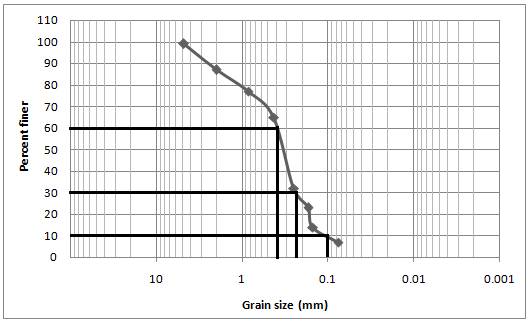
Conclusion:
The values of
(c)
The value of uniformity coefficient
Answer to Problem 19P
Explanation of Solution
Given information:
| Sieve No. | Sieve No. | Percent finer |
| | | |
| | | |
| | | |
| | | |
| | | |
| | | |
| | | |
| | | |
| Pan | Pan | -- |
Concept used:
Calculation:
Conclusion:
The value of coefficient of uniformityis
(d)
The value of coefficient of gradation
Answer to Problem 19P
Explanation of Solution
Given information:
| Sieve No. | Sieve No. | Percent finer |
| | | |
| | | |
| | | |
| | | |
| | | |
| | | |
| | | |
| | | |
| Pan | Pan | -- |
Concept used:
Calculation:
Conclusion:
The value of coefficient of uniformity is
Want to see more full solutions like this?


- Draw Isometric view of this multiview of object.arrow_forwardREMINDER: The truss must be cut into two different sections. You can choose either one to solve as you will get the same answer. Since there are three equations available, you can't cut more than three members 6.25 Determine the force in members BD, CD, and CE of the truss shown. BO C 36 kips 36 kips D F H 7.5 ft E G 4 panels at 10 ft = 40 ftarrow_forwardCalculate the area of the following polygon using the abscissa and projection method, taking into account the necessary adjustments before calculating the area of the polygon using the compass rule. Latitude Departure Side 930.63 N 930.63 S 1272 E 1271 W AB 122.14 E=12/2-1271-1 cr=-1 680 BC 173.83 length 591 CD 669.13 109.08 DE 139.36 961.1 EA 756.80 201.82 330.63/ 430.65 DEP=L SIN (O) >L DEP/SIN(O) LAT = L COS (0) DEPILATESIN(OYCOS (0)= TAN (0) O TAN-1 (DEP/LAT)= asztan Deptarrow_forward
- Estimate the material quantities (cement, sand, gravel, and steel reinforcement) required for constructing 120 m concrete channel of the following typical cross section, concrete mix of 1:1.5:3 and thickness of 20 cm. Figure (1) Figure (1) 12250- 16300arrow_forwarda) A 14-ft. tall and12-ft.-8-in. long fully grouted reinforced masonry wall is constructed of 8-in.CMU. It is to be analyzed for out-of-plane loading. Construct thenP -nM curves for the wallwith the following three vertical reinforcement scenarios: (1) 10 No. 6 bars at 16 in. spacing,(2) 10 No. 5 bars at 16 in. spacing, and (3) 7 No. 4 bars at 24 in. spacing. The steel is Grade60 with a modulus of elasticity of 29,000 ksi, and the masonry has a compressive strength of2,000 psi. You may use Excel or Matlab to construct the curves. Also, show the maximumnPallowed by the code for each case.(b) For each of the above reinforcement scenarios, determine the maximum axial loads that arepermitted for the tension-controlled condition and transition condition.(c) Discuss how the amount of vertical reinforcement affects thenPn-Mn curve.arrow_forwardYOU HAVE SET YOUR LEVEL UP AND ARE UTILIZING CP-101 ELEVATION FOR YOUR BENCHMARK AND HAVE THE FOLLOWING READING:CP-101=6.02YOUR FORM ELEVATION READINGS ("ATTACHED")( BEGINNING AT THE NORTHEAST BUILDING CORNER)AND WORKING IN A CLOCKWISE DIRECTION CHECKING THE BUILDING CORNER FORMSARE AS FOLLOWS: (CALCULATE THE ELEVATIONS OF 1-6 BELOW) 1. NE COR. = 1.152. SE COR. = 1.153. SW COR. = 1.354. (N) SW COR. = 1.155. INTERIOR = 1.306. NW COR. = 1.15arrow_forward
- a) A 14-ft. tall and12-ft.-8-in. long fully grouted reinforced masonry wall is constructed of 8-in.CMU. It is to be analyzed for out-of-plane loading. Construct thenP -nM curves for the wallwith the following three vertical reinforcement scenarios: (1) 10 No. 6 bars at 16 in. spacing,(2) 10 No. 5 bars at 16 in. spacing, and (3) 7 No. 4 bars at 24 in. spacing. The steel is Grade60 with a modulus of elasticity of 29,000 ksi, and the masonry has a compressive strength of2,000 psi. You may use Excel or Matlab to construct the curves. Also, show the maximumnPallowed by the code for each case.(b) For each of the above reinforcement scenarios, determine the maximum axial loads that arepermitted for the tension-controlled condition and transition condition.(c) Discuss how the amount of vertical reinforcement affects thenPn - Mn curve.arrow_forwardIf you could help me answer these questions in matlab that would be great, I provided an additional picture detailing what the outcome should look like.arrow_forwardA fully grouted reinforced masonry wall is to be constructed of 8-in. CMU. The wall height is 18feet. It is assumed to be simply supported. The wall is to be designed for an out-of-plane seismicload of 52 lbs./ft.2, which can act in either direction. The wall also supports a roof dead load of600 lbs./ft. and a roof live load of 300 lbs./ft. along the wall length. The roof loads have aneccentricity of 2.5 inches. Since there is seismic load, load combinations (6) and (7) in Chapter 2of ASCE 7-22 should be considered. In these two load combinations,horizontal seismic loadhE =andvertical seismic loadvE = . You may ignorevE in this problem for simplicity. The masonryhas a specified compressive strength of 2,500 psi. (a) Use the strength design provisions of TMS402 to determine the size and spacing of the vertical bars needed. Use the P-δ analysis method inSection 9.3.4.4.2 of TMS 402 to determine Mu. (b) Repeat the design using the momentmagnification method in Section 9.3.4.4.3 instead.arrow_forward
- The factor of safety for tipping of the concrete dam is defined as the ratio of the stabilizing moment due to the dam's weight divided by the overturning moment about OO due to the water pressure (Figure 1). Suppose that aa = 5 mm , dd = 2 mm , hh = 7 mm . The concrete has a density of ρconcρconc = 2.5 Mg/m3Mg/m3 and for water ρwρw = 1 Mg/m3Mg/m3arrow_forwardcan you answer both plss, i will give u a likearrow_forward*1-4. The hollow core panel is made from plain stone concrete. Determine the dead weight of the panel. The holes each have a diameter of 100 mm. 200 mm 300 mm 300 mm 300 mm 300 mm 300 mm Prob. 1-4 300 mm 4 marrow_forward
 Fundamentals of Geotechnical Engineering (MindTap...Civil EngineeringISBN:9781305635180Author:Braja M. Das, Nagaratnam SivakuganPublisher:Cengage Learning
 Principles of Geotechnical Engineering (MindTap C...Civil EngineeringISBN:9781305970939Author:Braja M. Das, Khaled SobhanPublisher:Cengage Learning
 Traffic and Highway EngineeringCivil EngineeringISBN:9781305156241Author:Garber, Nicholas J.Publisher:Cengage Learning
 Principles of Foundation Engineering (MindTap Cou...Civil EngineeringISBN:9781337705028Author:Braja M. Das, Nagaratnam SivakuganPublisher:Cengage Learning
 Principles of Foundation Engineering (MindTap Cou...Civil EngineeringISBN:9781305081550Author:Braja M. DasPublisher:Cengage Learning