
Concept explainers
(a)
Interpretation:
For an angle of incidence of 450, the effective penetration depth of the evanescent wave should be determined. Penetration depth if the angle changed to 600 should be determined.
Concept introduction:
The effective penetration depth can be calculated as follows:
Here,
Answer to Problem 17.13QAP
When the angle of incidence = 450
When the angle of incidence = 600
Explanation of Solution
When the angle of incidence = 450
When the angle of incidence = 600
(b)
Interpretation:
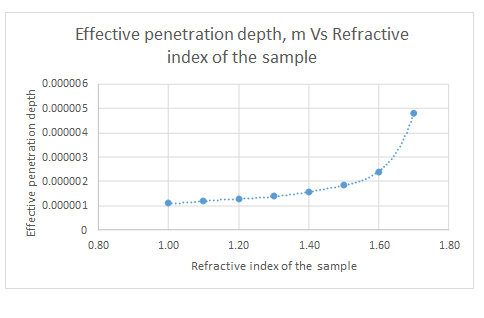
The penetration depths for sample refractive indexes varying from 1.00 to 1.70 in steps of 0.10 should be determined. Penetration depth should be plotted as a function of refractive index. The refractive index for which the penetration depth becomes zero should be determined.
Concept introduction:
Answer to Problem 17.13QAP
The plot is represented as follows:
Explanation of Solution
The data given is as follows:
| Refractive index of sample | dp, m |
| 1.00 | 1.12597E-06 |
| 1.10 | 1.19018E-06 |
| 1.20 | 1.27491E-06 |
| 1.30 | 1.39125E-06 |
| 1.40 | 1.56143E-06 |
| 1.50 | 1.8387E-06 |
| 1.60 | 2.40057E-06 |
| 1.70 | 4.80114E-06 |
The plot for the data is represented as follows:
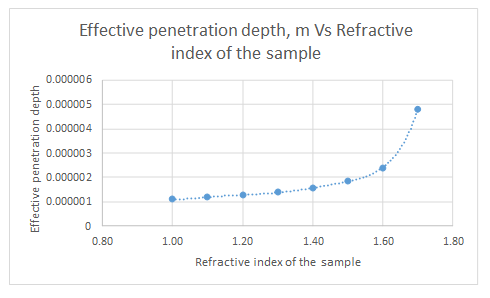
From the graph, it can be seen that the refractive index never approaches zero.
(c)
Interpretation:
For a sample with a refractive index 1.37 at 2000 cm-1 and incident angle of 450, the penetration depth versus the ATR crystal refractive index should be plotted.
Concept introduction:
The effective penetration depth can be calculated as follows:
Here,
Answer to Problem 17.13QAP
Ge crystal will give smaller penetration depth as a refractive index of the crystal increases, the effective penetration depth decreases.
Explanation of Solution
The data given is as follows:
| Refractive index of Crystal | dp, m |
| 2.00 | 4.53849E-06 |
| 2.25 | 2.21456E-06 |
| 2.50 | 1.78166E-06 |
| 2.75 | 1.58661E-06 |
| 3.00 | 1.47477E-06 |
| 3.25 | 1.40242E-06 |
| 3.50 | 1.35201E-06 |
| 3.75 | 1.31509E-06 |
| 4.00 | 1.28702E-06 |
The plot is represented as follows:
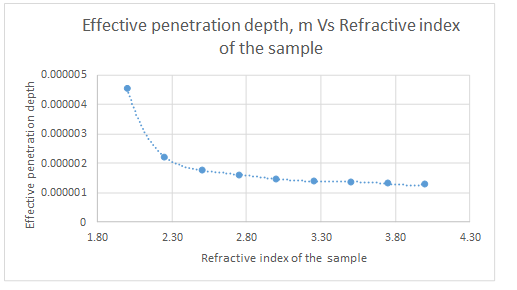
Ge crystal will give smaller penetration depth as a refractive index of the crystal increases, the effective penetration depth decreases.
(d)
Interpretation:
The effective penetration depth at 3000 cm-1, 2000 cm-1 and 2000 cm-1 should be determined.
Concept introduction:
The effective penetration depth can be calculated as follows:
Here,
Answer to Problem 17.13QAP
At 3000 cm-1
At 2000 cm-1
At 1000 cm-1
Explanation of Solution
At 3000 cm-1
At 2000 cm-1
At 1000 cm-1
In case of analyzing aqueous samples, pouring shallow amount over the surface of the crystal is sufficient. Since trace amounts are used to analyze, absorption by the aqueous solvent is not a problem.
(e)
Interpretation:
The principles of the new method to obtain a depth profile of a sample surface using ATR spectroscopy should be described.
Concept introduction:
In ATR spectroscopy through the ATR crystal, an infrared beam is passed such that it reflects off the internal surface at least once when in contact with the sample. This reflection results in an evanescent wave which goes into the sample. The penetration depth is determined by the wavelength of IR beam, angle of incidence, refractive indexes of sample and the crystal.
Explanation of Solution
A new depth profiling method using multiple-angle ATR/FT-IR spectroscopy has been developed.
First, a profile frequency is defined then the stratified medium is defined. Matrix A is generated from interpolated absorptances and matrix E is generated from estimated mean square electric fields. Linear equations of absorptance by SVD method is solved and the first estimated refractive index profile from matrix X is calculated. Nonlinear fittings of the reflectances are determined by Levenberg-Marquadt method. Finally, complex refractive index profile is obtained.
Want to see more full solutions like this?
Chapter 17 Solutions
Principles of Instrumental Analysis


- elow are experimentally determined van Deemter plots of column efficiency, H, vs. flow rate. H is a quantitative measurement of band broadening. The left plot is for a liquid chromatography application and the night is for gas chromatography. Compare and contrast these two plots in terms of the three band broadening mechanisms presented in this activity. How are they similar? How do they differ? Justify your answers.? 0.4 H (mm) 0.2 0.1- 0.3- 0 0.5 H (mm) 8.0 7.0 6.0 5.0 4.0- 3.0 T +++ 1.0 1.5 0 2.0 4.0 Flow Rate, u (cm/s) 6.0 8.0 Flow Rate, u (cm/s)arrow_forwardPredict the products of this organic reaction: + H ZH NaBH3CN H+ n. ? Click and drag to start drawing a structure. Xarrow_forwardWhat is the missing reactant R in this organic reaction? + R H3O+ + • Draw the structure of R in the drawing area below. • Be sure to use wedge and dash bonds if it's necessary to draw one particular enantiomer. Click and drag to start drawing a structure.arrow_forward
- What would be the best choices for the missing reagents 1 and 3 in this synthesis? 1 1. PPh3 2. n-BuLi 2 • Draw the missing reagents in the drawing area below. You can draw them in any arrangement you like. • Do not draw the missing reagent 2. If you draw 1 correctly, we'll know what it is. • Note: if one of your reagents needs to contain a halogen, use bromine. Click and drag to start drawing a structure.arrow_forwardThe product on the right-hand side of this reaction can be prepared from two organic reactants, under the conditions shown above and below the arrow. Draw 1 and 2 below, in any arrangement you like. 1+2 NaBH₂CN H+ N Click and drag to start drawing a structure. X $arrow_forwardExplain what is the maximum absorbance of in which caffeine absorbs?arrow_forward
- Explain reasons as to why the amount of caffeine extracted from both a singular extraction (5ml Mountain Dew) and a multiple extraction (2 x 5.0ml Mountain Dew) were severely high when compared to coca-cola?arrow_forwardProtecting Groups and Carbonyls 6) The synthesis generates allethrolone that exhibits high insect toxicity but low mammalian toxicity. They are used in pet shampoo, human lice shampoo, and industrial sprays for insects and mosquitos. Propose detailed mechanistic steps to generate the allethrolone label the different types of reagents (Grignard, acid/base protonation, acid/base deprotonation, reduction, oxidation, witting, aldol condensation, Robinson annulation, etc.) III + VI HS HS H+ CH,CH,Li III I II IV CI + P(Ph)3 V ༼ Hint: no strong base added VI S VII IX HO VIII -MgBr HgCl2,HgO HO. isomerization aqeuous solution H,SO, ༽༽༤༽༽ X MeOH Hint: enhances selectivity for reaction at the S X ☑arrow_forwardDraw the complete mechanism for the acid-catalyzed hydration of this alkene. esc 田 Explanation Check 1 888 Q A slock Add/Remove step Q F4 F5 F6 A བྲA F7 $ % 5 @ 4 2 3 & 6 87 Click and drag to start drawing a structure. © 2025 McGraw Hill LLC. All Rights Reserved. Terms of Use | Privacy Ce W E R T Y U S D LL G H IK DD 요 F8 F9 F10 F1 * ( 8 9 0 O P J K L Z X C V B N M H He commandarrow_forward
- Explanation Check F1 H₂O H₂ Pd 1) MCPBA 2) H3O+ 1) Hg(OAc)2, H₂O 2) NaBH4 OH CI OH OH OH hydration halohydrin formation addition halogenation hydrogenation inhalation hydrogenation hydration ☐ halohydrin formation addition halogenation formation chelation hydrogenation halohydrin formation substitution hydration halogenation addition Ohalohydrin formation subtraction halogenation addition hydrogenation hydration F2 80 F3 σ F4 F5 F6 1 ! 2 # 3 $ 4 % 05 Q W & Å © 2025 McGraw Hill LLC. All Rights Reserved. F7 F8 ( 6 7 8 9 LU E R T Y U A F9arrow_forwardShow the mechanism steps to obtain the lowerenergy intermediate: *see imagearrow_forwardSoap is made by the previous reaction *see image. The main difference between one soap and another soap isthe length (number of carbons) of the carboxylic acid. However, if a soap irritates your skin, they mostlikely used too much lye.Detergents have the same chemical structure as soaps except for the functional group. Detergentshave sulfate (R-SO4H) and phosphate (R-PO4H2) functional groups. Draw the above carboxylic acidcarbon chain but as the two variants of detergents. *see imagearrow_forward
 Principles of Instrumental AnalysisChemistryISBN:9781305577213Author:Douglas A. Skoog, F. James Holler, Stanley R. CrouchPublisher:Cengage Learning