
Concept explainers
Videos
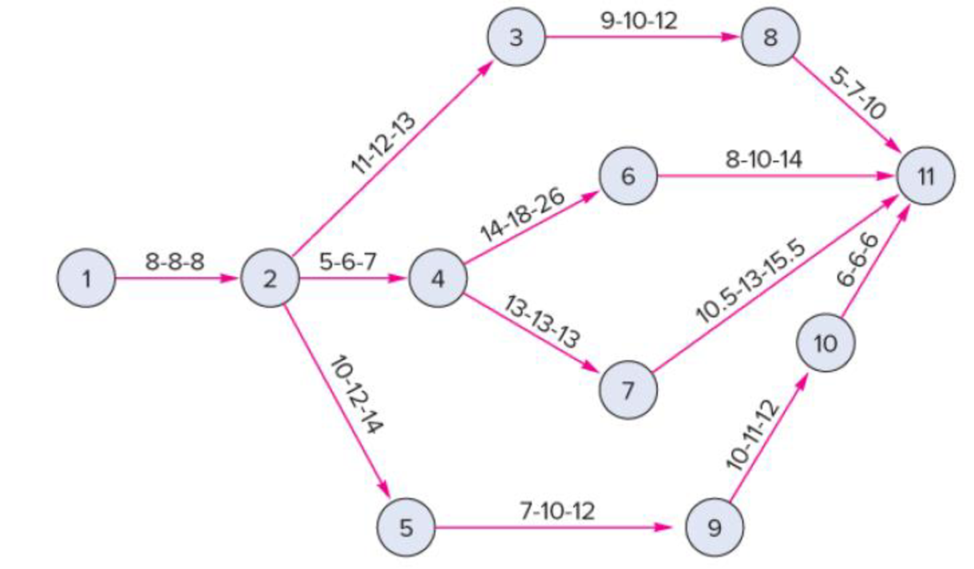
The following precedence diagram reflects three time estimates in weeks for each activity. Determine:
a. The expected completion time for each path and its variance.
b. The probability that the project will require more than 49 weeks.
c. The probability that the project can be completed in 46 weeks or less.
a)
To determine: The expected completion time for each path and its variance.
Explanation of Solution
Given information:
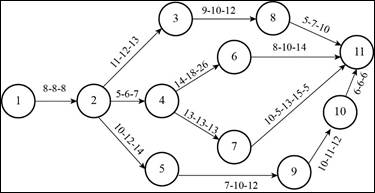
| Activity | Optimistic time | Most likely time | Pessimistic time |
| 1 to 2 | 8 | 8 | 8 |
| 2 to 3 | 11 | 12 | 13 |
| 2 to 4 | 5 | 6 | 7 |
| 2 to 5 | 10 | 12 | 14 |
| 3 to 8 | 9 | 10 | 12 |
| 4 to 6 | 14 | 18 | 26 |
| 4 to 7 | 13 | 13 | 13 |
| 5 to 9 | 7 | 10 | 12 |
| 6 to 11 | 8 | 10 | 14 |
| 7 to 11 | 10.5 | 13 | 15.5 |
| 8 to 11 | 5 | 7 | 10 |
| 9 to 10 | 10 | 11 | 12 |
| 10 to 11 | 6 | 6 | 6 |
Formula to calculate expected time and variance:
Calculation of mean and variance:
| Activity | Optimistic time | Most likely time | Pessimistic time | Expected time | Standard deviation | Variance |
| A | B | C | (A+(4*B)+C)/6 | (C-A)/6 | (C-A)^2/6^2 | |
| 1 to 2 | 8 | 8 | 8 | 8 | 0.000 | 0.000 |
| 2 to 3 | 11 | 12 | 13 | 12 | 0.333 | 0.111 |
| 2 to 4 | 5 | 6 | 7 | 6 | 0.333 | 0.111 |
| 2 to 5 | 10 | 12 | 14 | 12 | 0.667 | 0.444 |
| 3 to 8 | 9 | 10 | 12 | 10.17 | 0.500 | 0.250 |
| 4 to 6 | 14 | 18 | 26 | 18.67 | 2.000 | 4.000 |
| 4 to 7 | 13 | 13 | 13 | 13 | 0.000 | 0.000 |
| 5 to 9 | 7 | 10 | 12 | 9.83 | 0.833 | 0.694 |
| 6 to 11 | 8 | 10 | 14 | 10.33 | 1.000 | 1.000 |
| 7 to 11 | 10.5 | 13 | 15.5 | 13 | 0.833 | 0.694 |
| 8 to 11 | 5 | 7 | 10 | 7.17 | 0.833 | 0.694 |
| 9 to 10 | 10 | 11 | 12 | 11 | 0.333 | 0.111 |
| 10 to 11 | 6 | 6 | 6 | 6 | 0.000 | 0.000 |
Calculation of expected duration, variance and standard deviation for each path:
Path 1-2-3-8-11:
Path 1-2-4-6-11:
Path 1-2-4-7-11:
Path 1-2-5-9-11:
b)
To determine: The probability that the project will require more than 49 weeks.
Answer to Problem 11P
Explanation of Solution
Calculation of probability of completion in more than 49 weeks:
Calculation of z value for all paths:
Formula:
Greater than 49 weeks:
Path 1-2-3-8-11:
Since z value is greater than +3.00, probability of completion is 1.00.
Path 1-2-4-6-11:
From the standard normal distribution table,
The probability value for (z = 2.261) is 0.9960.
Path 1-2-4-7-11:
Since z value is greater than +3.00, probability of completion is 1.00.
Path 1-2-5-9-10-11:
From the standard normal distribution table,
The probability value for (z = 1.94) is 0.9738.
Probability of completion in less than or equal to 49 weeks:
Calculation of probability of completion in greater than 49 weeks:
The probability that the project will require more than 49 weeks is 0.0301.
c)
To determine: The probability that the project will be completed in 46 weeks or less.
Answer to Problem 11P
Explanation of Solution
Calculation of probability of completion in 46 weeks or less:
Calculation of z value for all paths:
Formula:
Path 1-2-3-8-11:
Since z value is greater than +3.00, probability of completion is 1.00.
Path 1-2-4-6-11:
From the standard normal distribution table,
The probability value for (z = 1.33) is 0.9082.
Path 1-2-4-7-11:
Since z value is greater than +3.00, probability of completion is 1.00.
Path 1-2-5-9-10-11:
From the standard normal distribution table,
The probability value for (z = -0.74) is 0.2296.
Probability of completion in less than or equal to 46 weeks:
The probability that the project will be completed in 46 weeks or less is 0.2085.
Want to see more full solutions like this?
Chapter 17 Solutions
Operations Management (Comp. Instructor's Edition)


- 1. Define risk management and explain its importance in a small business. 2. Describe three types of risks commonly faced by entrepreneurs. 3. Explain the purpose of a risk register. 4. List and briefly describe four risk response strategies. (5 marks) (6 marks) (4 marks) (8 marks) 5. Explain how social media can pose a risk to small businesses. (5 marks) 6. Identify and describe any four hazard-based risks. (8 marks) 7. Mention four early warning indicators that a business may be at risk. (4 marks)arrow_forwardState whether each of the following statements is TRUE or FALSE. 1. Risk management involves identifying, analysing, and mitigating risks. 2. Hazard risks include interest rate fluctuations. 3. Entrepreneurs should avoid all forms of risks. 4. SWOT analysis is a tool for risk identification. 5. Scenario building helps visualise risk responses. 6. Risk appetite defines how much risk an organisation is willing to accept. 7. Diversification is a risk reduction strategy. 8. A risk management framework must align with business goals. 9. Political risk is only relevant in unstable countries. 10. All risks can be eliminated through insurance.arrow_forward9. A hazard-based risk includes A. Political instability B. Ergonomic issues C. Market demand D. Taxation changesarrow_forward
- 8. Early warning indicators help businesses to A. Avoid legal actions B. Grow rapidly C. Detect potential risks D. Hire employees 9. A hazard-based risk includes A. Political instability B. Ergonomic issues C. Market demand D. Taxation changesarrow_forward10. Which risk category refers to taking advantage of a new opportunity despite potential challenges? A. Hazard B. Uncertainty C. Opportunity D. Strategicarrow_forward6. A business continuity plan is mainly used to_ A. Increase profits B. Handle daily tasks C. Prepare for disruptions D. Advertise services 7. What is the role of a risk owner? A. To finance the risk B. To monitor and manage a specific risk C. To create risks D. To avoid planning 8. Early warning indicators help businesses to_ A. Avoid legal actions B. Grow rapidly C. Detect potential risks D. Hire employees 9. A hazard-based risk includes_ A. Political instability B. Ergonomic issues C. Market demand D. Taxation changesarrow_forward
 Practical Management ScienceOperations ManagementISBN:9781337406659Author:WINSTON, Wayne L.Publisher:Cengage,