
Probability and Statistics for Engineering and the Sciences STAT 400 - University Of Maryland
9th Edition
ISBN: 9781305764477
Author: Jay L. Devore
Publisher: Cengage Learning
expand_more
expand_more
format_list_bulleted
Concept explainers
Videos
Textbook Question
Chapter 16.3, Problem 16E
A manufacturer of dustless chalk instituted a quality control program to monitor chalk density. The sample standard deviations of densities for 24 different subgroups, each consisting of n = 8 chalk specimens, were as follows:
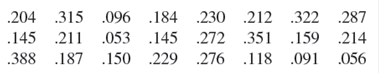
Calculate limits for an S chart, construct the chart, and check for out-of-control points. If there is an out-of-control point, delete it and repeat the process.
Expert Solution & Answer

Trending nowThis is a popular solution!

Students have asked these similar questions
We consider the one-period model studied in class as an example. Namely, we assumethat the current stock price is S0 = 10. At time T, the stock has either moved up toSt = 12 (with probability p = 0.6) or down towards St = 8 (with probability 1−p = 0.4).We consider a call option on this stock with maturity T and strike price K = 10. Theinterest rate on the money market is zero.As in class, we assume that you, as a customer, are willing to buy the call option on100 shares of stock for $120. The investor, who sold you the option, can adopt one of thefollowing strategies: Strategy 1: (seen in class) Buy 50 shares of stock and borrow $380. Strategy 2: Buy 55 shares of stock and borrow $430. Strategy 3: Buy 60 shares of stock and borrow $480. Strategy 4: Buy 40 shares of stock and borrow $280.(a) For each of strategies 2-4, describe the value of the investor’s portfolio at time 0,and at time T for each possible movement of the stock.(b) For each of strategies 2-4, does the investor have…
Negate the following compound statement using De Morgans's laws.
Negate the following compound statement using De Morgans's laws.
Chapter 16 Solutions
Probability and Statistics for Engineering and the Sciences STAT 400 - University Of Maryland
Ch. 16.1 - A control chart for thickness of rolled-steel...Ch. 16.1 - Refer to Exercise 1 and suppose the ten most...Ch. 16.1 - Suppose a control chart is constructed so that the...Ch. 16.1 - A cork intended for use in a wine bottle is...Ch. 16.1 - If a process variable is normally distributed, in...Ch. 16.2 - In the case of known and , what control limits...Ch. 16.2 - Consider a 3-sigma control chart with a center...Ch. 16.2 - The table below gives data on moisture content for...Ch. 16.2 - Refer to the data given in Exercise 8, and...Ch. 16.2 - When installing a bath faucet, it is important to...
Ch. 16.2 - The accompanying table gives sample means and...Ch. 16.2 - The accompanying table gives sample means and...Ch. 16.2 - Prob. 13ECh. 16.2 - Prob. 14ECh. 16.2 - Prob. 15ECh. 16.3 - A manufacturer of dustless chalk instituted a...Ch. 16.3 - Subgroups of power supply units are selected once...Ch. 16.3 - Prob. 18ECh. 16.3 - The accompanying table gives sample means and...Ch. 16.3 - Prob. 20ECh. 16.4 - On each of the previous 25 days, 100 electronic...Ch. 16.4 - A sample of 200 ROM computer chips was selected on...Ch. 16.4 - Prob. 23ECh. 16.4 - Prob. 24ECh. 16.4 - Prob. 25ECh. 16.4 - Prob. 26ECh. 16.4 - Prob. 27ECh. 16.4 - Prob. 28ECh. 16.5 - Prob. 29ECh. 16.5 - Prob. 30ECh. 16.5 - The standard deviation of a certain dimension on...Ch. 16.5 - Prob. 32ECh. 16.6 - Consider the single-sample plan with c = 2 and n =...Ch. 16.6 - A sample of 50 items is to be selected from a...Ch. 16.6 - Prob. 35ECh. 16.6 - Develop a single-sample plan for which AQL = .02...Ch. 16.6 - Consider the double-sampling plan for which both...Ch. 16.6 - Prob. 38ECh. 16.6 - Refer to Example 16.11, in which a single-sample...Ch. 16.6 - Consider the single-sample plan that utilizes n =...Ch. 16 - Observations on shear strength for 26 subgroups of...Ch. 16 - The number of scratches on the surface of each of...Ch. 16 - The following numbers are observations on tensile...Ch. 16 - Prob. 44SECh. 16 - Prob. 46SE
Knowledge Booster


Learn more about
Need a deep-dive on the concept behind this application? Look no further. Learn more about this topic, statistics and related others by exploring similar questions and additional content below.Similar questions
- Question 6: Negate the following compound statements, using De Morgan's laws. A) If Alberta was under water entirely then there should be no fossil of mammals.arrow_forwardNegate the following compound statement using De Morgans's laws.arrow_forwardCharacterize (with proof) all connected graphs that contain no even cycles in terms oftheir blocks.arrow_forward
- Let G be a connected graph that does not have P4 or C3 as an induced subgraph (i.e.,G is P4, C3 free). Prove that G is a complete bipartite grapharrow_forwardProve sufficiency of the condition for a graph to be bipartite that is, prove that if G hasno odd cycles then G is bipartite as follows:Assume that the statement is false and that G is an edge minimal counterexample. That is, Gsatisfies the conditions and is not bipartite but G − e is bipartite for any edge e. (Note thatthis is essentially induction, just using different terminology.) What does minimality say aboutconnectivity of G? Can G − e be disconnected? Explain why if there is an edge between twovertices in the same part of a bipartition of G − e then there is an odd cyclearrow_forwardLet G be a connected graph that does not have P4 or C4 as an induced subgraph (i.e.,G is P4, C4 free). Prove that G has a vertex adjacent to all othersarrow_forward
- We consider a one-period market with the following properties: the current stock priceis S0 = 4. At time T = 1 year, the stock has either moved up to S1 = 8 (with probability0.7) or down towards S1 = 2 (with probability 0.3). We consider a call option on thisstock with maturity T = 1 and strike price K = 5. The interest rate on the money marketis 25% yearly.(a) Find the replicating portfolio (φ, ψ) corresponding to this call option.(b) Find the risk-neutral (no-arbitrage) price of this call option.(c) We now consider a put option with maturity T = 1 and strike price K = 3 onthe same market. Find the risk-neutral price of this put option. Reminder: A putoption gives you the right to sell the stock for the strike price K.1(d) An investor with initial capital X0 = 0 wants to invest on this market. He buysα shares of the stock (or sells them if α is negative) and buys β call options (orsells them is β is negative). He invests the cash balance on the money market (orborrows if the amount is…arrow_forwardDetermine if the two statements are equivalent using a truth tablearrow_forwardQuestion 4: Determine if pair of statements A and B are equivalent or not, using truth table. A. (~qp)^~q в. р л~9arrow_forward
- Determine if the two statements are equalivalent using a truth tablearrow_forwardQuestion 3: p and q represent the following simple statements. p: Calgary is the capital of Alberta. A) Determine the value of each simple statement p and q. B) Then, without truth table, determine the va q: Alberta is a province of Canada. for each following compound statement below. pvq р^~q ~рл~q ~q→ p ~P~q Pq b~ (d~ ← b~) d~ (b~ v d) 0 4arrow_forward2. Let X be a random variable. (a) Show that, if E X2 = 1 and E X4arrow_forwardarrow_back_iosSEE MORE QUESTIONSarrow_forward_ios
Recommended textbooks for you
 Glencoe Algebra 1, Student Edition, 9780079039897...AlgebraISBN:9780079039897Author:CarterPublisher:McGraw Hill
 Big Ideas Math A Bridge To Success Algebra 1: Stu...AlgebraISBN:9781680331141Author:HOUGHTON MIFFLIN HARCOURTPublisher:Houghton Mifflin Harcourt
Glencoe Algebra 1, Student Edition, 9780079039897...
Algebra
ISBN:9780079039897
Author:Carter
Publisher:McGraw Hill
Big Ideas Math A Bridge To Success Algebra 1: Stu...
Algebra
ISBN:9781680331141
Author:HOUGHTON MIFFLIN HARCOURT
Publisher:Houghton Mifflin Harcourt
Statistics 4.1 Point Estimators; Author: Dr. Jack L. Jackson II;https://www.youtube.com/watch?v=2MrI0J8XCEE;License: Standard YouTube License, CC-BY
Statistics 101: Point Estimators; Author: Brandon Foltz;https://www.youtube.com/watch?v=4v41z3HwLaM;License: Standard YouTube License, CC-BY
Central limit theorem; Author: 365 Data Science;https://www.youtube.com/watch?v=b5xQmk9veZ4;License: Standard YouTube License, CC-BY
Point Estimate Definition & Example; Author: Prof. Essa;https://www.youtube.com/watch?v=OTVwtvQmSn0;License: Standard Youtube License
Point Estimation; Author: Vamsidhar Ambatipudi;https://www.youtube.com/watch?v=flqhlM2bZWc;License: Standard Youtube License