
Organic Chemistry (6th Edition)
6th Edition
ISBN: 9781260119107
Author: Janice Gorzynski Smith
Publisher: McGraw Hill Education
expand_more
expand_more
format_list_bulleted
Concept explainers
Videos
Textbook Question
Chapter 16.10, Problem 23P
Draw the products of each reaction.
a. 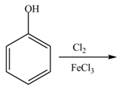 b.
b. 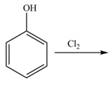 c.
c. 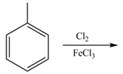
Expert Solution & Answer

Trending nowThis is a popular solution!

Students have asked these similar questions
Draw the formula of the product obtained by reacting adipic acid 1st with PCl5 and 2nd treatment with NH3.
please help me with my homework
help
Chapter 16 Solutions
Organic Chemistry (6th Edition)
Ch. 16.1 - Prob. 1PCh. 16.2 - Prob. 2PCh. 16.3 - Prob. 3PCh. 16.4 - Prob. 4PCh. 16.5 - Prob. 5PCh. 16.5 - Prob. 6PCh. 16.5 - Prob. 9PCh. 16.5 - Problem 18.9 Draw the product of each reaction
a....Ch. 16.5 - Prob. 11PCh. 16.5 - Prob. 12P
Ch. 16.5 - Prob. 13PCh. 16.6 - Prob. 14PCh. 16.6 - Problem 18.14 Draw all resonance structures for...Ch. 16.6 - Problem 18.15 Classify each substituent as...Ch. 16.7 - Prob. 17PCh. 16.9 - Prob. 22PCh. 16.10 - Problem 18.20 Draw the products of each...Ch. 16.10 - Prob. 24PCh. 16.11 - Problem 18.22 Draw the products formed when each...Ch. 16.12 - Problem 18.23 Devise a synthesis of each compound...Ch. 16.13 - Problem 18.24 Draw the products of each...Ch. 16.13 - Problem 18.25 Draw a stepwise mechanism for the...Ch. 16.13 - Problem 18.26 Draw the products of each...Ch. 16.13 - Prob. 30PCh. 16 - Prob. 37PCh. 16 - 18.35 What is the major product formed by an...Ch. 16 - 18.36 Draw the products formed when phenol is...Ch. 16 - Problem 18.37 Draw the products formed when each...Ch. 16 - 18.38 Draw the products of each reaction.
a. d....Ch. 16 - 18.39 What products are formed when benzene is...Ch. 16 - Prob. 49PCh. 16 - 18.47 For each of the following substituted...Ch. 16 - 18.48 Consider the tetracyclic aromatic compound...Ch. 16 - 18.49 For each N-substituted benzene, predict...Ch. 16 - Prob. 54PCh. 16 - 18.51 Using resonance structures, explain why a...Ch. 16 - Prob. 56PCh. 16 - 18.53 Rank the aryl halides in each group in order...Ch. 16 - Prob. 64PCh. 16 - Prob. 65PCh. 16 - Prob. 66PCh. 16 - 18.63 Synthesize each compound from benzene and...Ch. 16 - Problem 18.64 Synthesize each compound from...
Knowledge Booster


Learn more about
Need a deep-dive on the concept behind this application? Look no further. Learn more about this topic, chemistry and related others by exploring similar questions and additional content below.Similar questions
- The temperature on a sample of pure X held at 1.25 atm and -54. °C is increased until the sample boils. The temperature is then held constant and the pressure is decreased by 0.42 atm. On the phase diagram below draw a path that shows this set of changes. pressure (atm) 2 0 0 200 400 temperature (K) Xarrow_forwardQUESTION: Answer Question 5: 'Calculating standard error of regression' STEP 1 by filling in all the empty green boxes *The values are all provided in the photo attached*arrow_forwardpressure (atm) 3 The pressure on a sample of pure X held at 47. °C and 0.88 atm is increased until the sample condenses. The pressure is then held constant and the temperature is decreased by 82. °C. On the phase diagram below draw a path that shows this set of changes. 0 0 200 temperature (K) 400 аarrow_forward
- er your payment details | bar xb Home | bartleby x + aleksogi/x/isl.exe/1o u-lgNskr7j8P3jH-1Qs_pBanHhviTCeeBZbufuBYT0Hz7m7D3ZcW81NC1d8Kzb4srFik1OUFhKMUXzhGpw7k1 O States of Matter Sketching a described thermodynamic change on a phase diagram 0/5 The pressure on a sample of pure X held at 47. °C and 0.88 atm is increased until the sample condenses. The pressure is then held constant and the temperature is decreased by 82. °C. On the phase diagram below draw a path that shows this set of changes. pressure (atm) 1 3- 0- 0 200 Explanation Check temperature (K) 400 X Q Search L G 2025 McGraw Hill LLC. All Rights Reserved Terms of Use Privacy Cearrow_forward5.arrow_forward6.arrow_forward
- 0/5 alekscgi/x/sl.exe/1o_u-IgNglkr7j8P3jH-IQs_pBaHhvlTCeeBZbufuBYTi0Hz7m7D3ZcSLEFovsXaorzoFtUs | AbtAURtkqzol 1HRAS286, O States of Matter Sketching a described thermodynamic change on a phase diagram The pressure on a sample of pure X held at 47. °C and 0.88 atm is increased until the sample condenses. The pressure is then held constant and the temperature is decreased by 82. °C. On the phase diagram below draw a path that shows this set of changes. 3 pressure (atm) + 0- 0 5+ 200 temperature (K) 400 Explanation Check X 0+ F3 F4 F5 F6 F7 S 2025 McGraw Hill LLC All Rights Reserved. Terms of Use Privacy Center Accessibility Q Search LUCR + F8 F9 F10 F11 F12 * % & ( 5 6 7 8 9 Y'S Dele Insert PrtSc + Backsarrow_forward5.arrow_forward9arrow_forward
- alekscgi/x/lsl.exe/1o_u-IgNslkr7j8P3jH-IQs_pBanHhvlTCeeBZbufu BYTI0Hz7m7D3ZS18w-nDB10538ZsAtmorZoFusYj2Xu9b78gZo- O States of Matter Sketching a described thermodynamic change on a phase diagram 0/5 The pressure on a sample of pure X held at 47. °C and 0.88 atm is increased until the sample condenses. The pressure is then held constant and the temperature is decreased by 82. °C. On the phase diagram below draw a path that shows this set of changes. pressure (atm) 3- 200 temperature (K) Explanation Chick Q Sowncharrow_forward0+ aleksog/x/lsl.exe/1ou-lgNgkr7j8P3H-IQs pBaHhviTCeeBZbufuBYTOHz7m7D3ZStEPTBSB3u9bsp3Da pl19qomOXLhvWbH9wmXW5zm O States of Matter Sketching a described thermodynamic change on a phase diagram 0/5 Gab The temperature on a sample of pure X held at 0.75 atm and -229. °C is increased until the sample sublimes. The temperature is then held constant and the pressure is decreased by 0.50 atm. On the phase diagram below draw a path that shows this set of changes. F3 pressure (atm) 0- 0 200 Explanation temperature (K) Check F4 F5 ☀+ Q Search Chill Will an 9 ENG F6 F7 F8 F9 8 Delete F10 F11 F12 Insert PrtSc 114 d Ararrow_forwardx + LEKS: Using a phase diagram a X n/alekscgi/x/lsl.exe/10_u-IgNsikr7j8P3jH-IQs_pBan HhvlTCeeBZbufu BYTI0Hz7m7D3ZcHYUt80XL-5alyVpw ○ States of Matter Using a phase diagram to find a phase transition temperature or pressure Use the phase diagram of Substance X below to find the melting point of X when the pressure above the solid is 1.1 atm. pressure (atm) 16 08- solid liquid- 0 200 400 gas 600 temperature (K) Note: your answer must be within 25 °C of the exact answer to be graded correct. × 5arrow_forward
arrow_back_ios
SEE MORE QUESTIONS
arrow_forward_ios
Recommended textbooks for you
 Organic ChemistryChemistryISBN:9781305580350Author:William H. Brown, Brent L. Iverson, Eric Anslyn, Christopher S. FootePublisher:Cengage Learning
Organic Chemistry
Chemistry
ISBN:9781305580350
Author:William H. Brown, Brent L. Iverson, Eric Anslyn, Christopher S. Foote
Publisher:Cengage Learning
Nomenclature: Crash Course Chemistry #44; Author: CrashCourse;https://www.youtube.com/watch?v=U7wavimfNFE;License: Standard YouTube License, CC-BY