
Concept explainers
Videos
The following table contains information concerning four jobs that are awaiting processing at a work center.
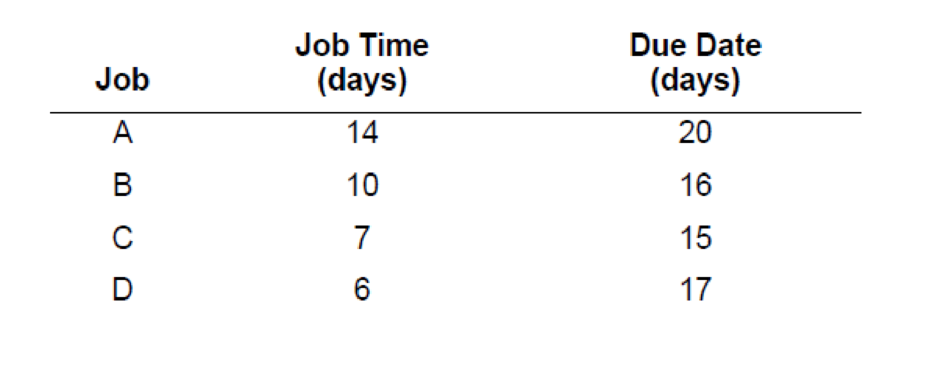
Sequence the jobs using (1) FCFS, (2) SPT, (3) EDD, and (4) CR. Assume the list is by order of arrival.
b. For each of the methods in part a, determine (1) the average job flow time, (2) the average tardiness, and (3) the average number of jobs at the work center.
c. Is one method superior to the others? Explain.
a)
1)
To determine: Sequence of jobs based on decision rule First Come First Served (FCFS).
Introduction: First Come First Served is the scheduling rule, which helps to arrange the sequence in the order. Here, the first come would be served first.
Answer to Problem 6P
Explanation of Solution
Given information:
| Job | Processing time (days) | Due date (days) |
| A | 14 | 20 |
| B | 10 | 16 |
| C | 7 | 15 |
| D | 6 | 17 |
Determine the sequence using FCFS:
According to FCFS, the first come would be served first. Hence, the jobs should be sequenced in the order as per its arrival.
Hence, the sequence of jobs using FCFS is A-B-C-D.
2)
To determine: Sequence of jobs based on decision rule Shortest Processing Time (SPT).
Introduction: Shortest Processing Tine is the scheduling rule, which helps to arrange the sequence in the order. Here, job with the shortest duration would be served first. Then, the process would be going on from shortest to largest duration.
Answer to Problem 6P
Explanation of Solution
Given information:
| Job | Processing time (days) | Due date (days) |
| A | 14 | 20 |
| B | 10 | 16 |
| C | 7 | 15 |
| D | 6 | 17 |
Determine the sequence using SPT:
According to SPT, the job that has the shortest processing would be served first and it goes on as the processing time increase. Duration should be assembled in the ascending order
Hence, the sequence of jobs using SPT is D-C-B-A.
3)
To determine: Sequence of jobs based on decision rule Earliest Due Date (EDD).
Introduction: Earliest Due Date is the scheduling rule, which helps to arrange the sequence in the order. Here, job with the earliest due date would be served first. Then, the process would be going on from earliest due date to latest due date.
Answer to Problem 6P
Explanation of Solution
Given information:
| Job | Processing time (days) | Due date (days) |
| A | 14 | 20 |
| B | 10 | 16 |
| C | 7 | 15 |
| D | 6 | 17 |
Determine the sequence using EDD:
According to EDD, the job that has the earliest due date would be served first and it goes on as the due date increases. The job should be arranged based on due date. Due date should be assembled in the ascending order
Hence, the sequence of jobs using EDD is C-B-D-A.
4)
To determine: Sequence of jobs based on decision rule critical ratio.
Introduction: Critical ratio is kind of scheduling rule that helps to identify that, the task or job is on the correct track. It would help to identify if the task is behind or ahead of the schedule.
Answer to Problem 6P
Explanation of Solution
Given information:
| Job | Processing time (days) | Due date (days) |
| A | 14 | 20 |
| B | 10 | 16 |
| C | 7 | 15 |
| D | 6 | 17 |
Determine the sequence using critical ratio:
Initial critical ratio should be determined at day 0:
| Job | Processing time (days) | Due date (days) | Critical ratio |
| A | 14 | 20 | 1.43 |
| B | 10 | 16 | 1.6 |
| C | 7 | 15 | 2.14 |
| D | 6 | 17 | 2.83 |
Critical ratio for Job A:
It is can be determined by dividing the value attained by subtracting the completion day of previous job from the due date of current job with the processing time.
Critical ratio for Job B:
It is can be determined by dividing the value attained by subtracting the completion day of previous job from the due date of current job with the processing time.
Critical ratio for Job C:
It is can be determined by dividing the value attained by subtracting the completion day of previous job from the due date of current job with the processing time.
Critical ratio for Job D:
It is can be determined by dividing the value attained by subtracting the completion day of previous job from the due date of current job with the processing time.
Job A has the lowest critical ratio. Thus, it will be completed first. Hence, Job A would be completed first in the sequence of jobs.
Determine the critical ratio after the completion of Job A:
As the processing time of job A is 14 days, completion day of completed day would be 14.
| Job | Processing time (days) | Due date (days) | Critical ratio |
| A | - | - | - |
| B | 10 | 16 | 0.20 |
| C | 7 | 15 | 0.14 |
| D | 6 | 17 | 0.50 |
Critical ratio for Job B:
It is can be determined by dividing the value attained by subtracting the completion day of completed job from the due date of current job with the processing time.
Critical ratio for Job C:
It is can be determined by dividing the value attained by subtracting the completion day of completed job from the due date of current job with the processing time.
Critical ratio for Job D:
It is can be determined by dividing the value attained by subtracting the completion day of completed job from the due date of current job with the processing time.
Job C has the lowest critical ratio. Hence, Job C would be completed next in the sequence of jobs after Job A.
Determine the critical ratio after the completion of Job A and Job C:
As the processing time of job A is 14 days and Job C is 7, completion day of completed day would be 21 (14+7).
| Job | Processing time (days) | Due date (days) | Critical ratio |
| A | - | - | - |
| B | 10 | 16 | -0.50 |
| C | |||
| D | 6 | 17 | -0.67 |
Critical ratio for Job B:
It is can be determined by dividing the value attained by subtracting the completion day of completed job from the due date of current job with the processing time.
Critical ratio for Job D:
It is can be determined by dividing the value attained by subtracting the completion day of completed job from the due date of current job with the processing time.
Job D has the lowest critical ratio. Hence, Job D would be completed next in the sequence of jobs after Job A and Job C.
As Job B is the remaining job, it will be completed next.
Hence, the sequence of jobs using critical ratio is A-C-D-B.
b)
To determine: Average flow time, average tardiness, and average number of jobs for each method.
Introduction: Rules that are framed for providing the order in which the jobs need to be performed are termed as priority rules. These rules are more suitable for process-oriented facilities. The main purpose of priority rules are on-time completion of jobs, efficient utilization of services, and the maximizing the customer services.
Answer to Problem 6P
Explanation of Solution
Given information:
| Job | Processing time (days) | Due date (days) |
| A | 14 | 20 |
| B | 10 | 16 |
| C | 7 | 15 |
| D | 6 | 17 |
First Come First Served:
| Job | Processing time (days) | Due date (days) | Flow time | Tardiness |
| A | 14 | 20 | 14 | 0 |
| B | 10 | 16 | 24 | 8 |
| C | 7 | 15 | 31 | 16 |
| D | 6 | 17 | 37 | 20 |
| Total | 37 | 68 | 106 | 44 |
| Average | 9.3 | 17.0 | 26.5 | 11.0 |
Supporting calculation:
Processing time and due date are given for each job. Flow time is the cumulative of the processing time.
Tardiness of Job A:
Flow time of Job A is less than its respective due date. Hence, there would be no tardiness.
Tardiness of Job B:
It is calculated by subtracting the flow time of the job from the due date of the project. Hence, the lateness of Job B is 8.
Tardiness of Job C:
It is calculated by subtracting the flow time of the job from the due date of the project. Hence, the lateness of Job C is 16.
Tardiness of Job D:
It is calculated by subtracting the flow time of the job from the due date of the project. Hence, the lateness of Job D is 20.
Average flow time:
It is calculated by dividing the total flow time and number of jobs.
Hence, average flow time is 26.5 days.
Average tardiness:
It is calculated by dividing the total tardiness and number of jobs.
Hence, average tardiness is 11.0 days
Average number of jobs:
It can be determined by dividing the total flow time and total processing time.
Hence, average number of jobs is 2.86 jobs.
Shortest processing time:
| Job | Processing time (days) | Due date (days) | Flow time | Tardiness |
| D | 6 | 17 | 6 | |
| C | 7 | 15 | 13 | |
| B | 10 | 16 | 23 | 7 |
| A | 14 | 20 | 37 | 17 |
| Total | 37 | 68 | 79 | 24 |
| Average | 9.3 | 17.0 | 19.8 | 12.0 |
Supporting calculation:
Processing time and due date are given for each job. Flow time is the cumulative of the processing time.
Tardiness of Job D and Job C:
Flow time of Job D and Job C is less than its respective due date. Hence, there would be no tardiness.
Tardiness of Job B:
It is calculated by subtracting the flow time of the job from the due date of the project. Hence, the lateness of Job B is 7.
Tardiness of Job A:
It is calculated by subtracting the flow time of the job from the due date of the project. Hence, the lateness of Job A is 17.
Average flow time:
It is calculated by dividing the total flow time and number of jobs.
Hence, average flow time is 19.75 days.
Average tardiness:
It is calculated by dividing the total tardiness and number of jobs.
Hence, average tardiness is 6.0 days
Average number of jobs:
It can be determined by dividing the total flow time and total processing time.
Hence, average number of jobs is 2.14 jobs.
Earliest Due Date:
| Job | Processing time (days) | Due date (days) | Flow time | Tardiness |
| C | 7 | 15 | 7 | |
| B | 10 | 16 | 17 | 1 |
| D | 6 | 17 | 23 | 6 |
| A | 14 | 20 | 37 | 17 |
| Total | 37 | 68 | 84 | 24 |
| Average | 9.3 | 17.0 | 21.0 | 8.0 |
Supporting calculation:
Processing time and due date are given for each job. Flow time is the cumulative of the processing time.
Tardiness of Job C:
Flow time of Job C is less than its respective due date. Hence, there would be no tardiness.
Tardiness of Job B:
It is calculated by subtracting the flow time of the job from the due date of the project. Hence, the lateness of Job B is 1.
Tardiness of Job D:
It is calculated by subtracting the flow time of the job from the due date of the project. Hence, the lateness of Job D is 6.
Tardiness of Job A:
It is calculated by subtracting the flow time of the job from the due date of the project. Hence, the lateness of Job A is 17.
Average flow time:
It is calculated by dividing the total flow time and number of jobs.
Hence, average flow time is 21.00 days.
Average tardiness:
It is calculated by dividing the total tardiness and number of jobs.
Hence, average tardiness is 6.0 days
Average number of jobs:
It can be determined by dividing the total flow time and total processing time.
Hence, average number of jobs is 2.27 jobs.
Critical ratio:
| Job | Processing time (days) | Due date (days) | Flow time | Tardiness |
| A | 14 | 20 | 14 | 0 |
| C | 7 | 15 | 21 | 6 |
| D | 6 | 17 | 27 | 10 |
| B | 10 | 16 | 37 | 21 |
| Total | 37 | 68 | 99 | 37 |
| Average | 9.3 | 17.0 | 24.8 | 9.3 |
Supporting calculation:
Processing time and due date are given for each job. Flow time is the cumulative of the processing time.
Tardiness of Job A:
Flow time of Job A is less than its respective due date. Hence, there would be no tardiness.
Tardiness of Job C:
It is calculated by subtracting the flow time of the job from the due date of the project. Hence, the lateness of Job C is 6.
Tardiness of Job D:
It is calculated by subtracting the flow time of the job from the due date of the project. Hence, the lateness of Job D is 10.
Tardiness of Job B:
It is calculated by subtracting the flow time of the job from the due date of the project. Hence, the lateness of Job B is 21.
Average flow time:
It is calculated by dividing the total flow time and number of jobs.
Hence, average flow time is 24.75 days.
Average tardiness:
It is calculated by dividing the total tardiness and number of jobs.
Hence, average tardiness is 9.25 days
Average number of jobs:
It can be determined by dividing the total flow time and total processing time.
Hence, average number of jobs is 2.68 jobs.
c)
To determine: The method which is superior to others.
Introduction: Rules that are framed for providing the order in which the jobs need to be performed are termed as priority rules. These rules are more suitable for process-oriented facilities. The main purpose of priority rules are on-time completion of jobs, efficient utilization of services, and the maximizing the customer services.
Answer to Problem 6P
Explanation of Solution
Given information:
| Job | Processing time (days) | Due date (days) |
| A | 14 | 20 |
| B | 10 | 16 |
| C | 7 | 15 |
| D | 6 | 17 |
Determine the method which is superior to other:
Shortest Processing Time (SPT) is the method which is superior to other, as it is the method which would provide lowest value when compare to others.
Want to see more full solutions like this?
Chapter 16 Solutions
EBK OPERATIONS MANAGEMENT


- Given how TPS has helped change things in so many fields, do you think there are parts of it that might be hard to use in areas that aren’t about making things, like in healthcare or services? If so, why do you think that might be?arrow_forwardDo you feel there is anything positive about rework?arrow_forwardDo you think technology can achieve faster setup times? How would it be implemented in the hospital workforce?arrow_forward
- In your experience or opinion, do you think process changes like organizing workspaces make a bigger difference, or is investing in technology usually the better solution for faster setups?arrow_forwardHave you seen rework done in your business, and what was done to prevent that from occurring again?arrow_forwardResearch a company different than case studies examined and search the internet and find an example of a business that had to rework a process. How was the organization affected to rework a process in order to restore a good flow unit? Did rework hurt a process or improve the organization's operational efficiency? • Note: Include a reference with supportive citations in the discussion reply in your post.arrow_forward
- Setup time is very important in affecting a process and the capacity of a process. How do you reduce setup time? Give examples of reducing setup time. Please Provide a referenecearrow_forwardDo you think TPS was successful? If so, how? Are there other companies that have used TPS? If so, give examples. Please provide a referencearrow_forwardGiven the significant impact on finances, production timelines, and even equipment functionality, as you pointed out, what do you believe is the most effective single strategy a company can implement to significantly reduce the occurrence of rework within their operations?arrow_forward
- Durban woman, Nombulelo Mkumla, took to social media last week to share how she discovered the rodent.In a lengthy Facebook post, she said she purchased the loaf of bread from a local shop after work on August 27.For the next days, Mkumla proceeded to use slices of bread from the load to make toast."Then, on the morning of August 31, I took the bread out of the fridge to make toast and noticed something disgusting andscary. I took a picture and sent it to my friends, and one of them said, 'Yi mpuku leyo tshomi' [That's a rat friend]“."I was in denial and suggested it might be something else, but the rat scenario made sense - it's possible the rat got into thebread at the factory, and no one noticed," Mkumla said.She went back to the shop she'd bought the bread from and was told to lay a complaint directly with the supplier.She sent an email with a video and photographs of the bread.Mkumla said she was later contacted by a man from Sasko who apologised for the incident.According to…arrow_forwardPepsiCo South Africa says the incident where a woman discovered part of a rodent in her loaf of bread, is anisolated occurrence.Durban woman, Nombulelo Mkumla, took to social media last week to share how she discovered the rodent.In a lengthy Facebook post, she said she purchased the loaf of bread from a local shop after work on August 27.For the next days, Mkumla proceeded to use slices of bread from the load to make toast."Then, on the morning of August 31, I took the bread out of the fridge to make toast and noticed something disgusting andscary. I took a picture and sent it to my friends, and one of them said, 'Yi mpuku leyo tshomi' [That's a rat friend]“."I was in denial and suggested it might be something else, but the rat scenario made sense - it's possible the rat got into thebread at the factory, and no one noticed," Mkumla said.She went back to the shop she'd bought the bread from and was told to lay a complaint directly with the supplier.She sent an email with a video and…arrow_forwardDurban woman, Nombulelo Mkumla, took to social media last week to share how she discovered the rodent.In a lengthy Facebook post, she said she purchased the loaf of bread from a local shop after work on August 27.For the next days, Mkumla proceeded to use slices of bread from the load to make toast."Then, on the morning of August 31, I took the bread out of the fridge to make toast and noticed something disgusting andscary. I took a picture and sent it to my friends, and one of them said, 'Yi mpuku leyo tshomi' [That's a rat friend]“."I was in denial and suggested it might be something else, but the rat scenario made sense - it's possible the rat got into thebread at the factory, and no one noticed," Mkumla said.She went back to the shop she'd bought the bread from and was told to lay a complaint directly with the supplier.She sent an email with a video and photographs of the bread.Mkumla said she was later contacted by a man from Sasko who apologised for the incident.According to…arrow_forward
 Practical Management ScienceOperations ManagementISBN:9781337406659Author:WINSTON, Wayne L.Publisher:Cengage,
 MarketingMarketingISBN:9780357033791Author:Pride, William MPublisher:South Western Educational Publishing