Videos
FORECASTING THE FUTURE PERFORMANCE OF ABERCROMBIE & FITCH
Use online resources to work on this chapter’s questions. Please note that website information changes over time, and these changes may limit your ability to answer some of these questions.
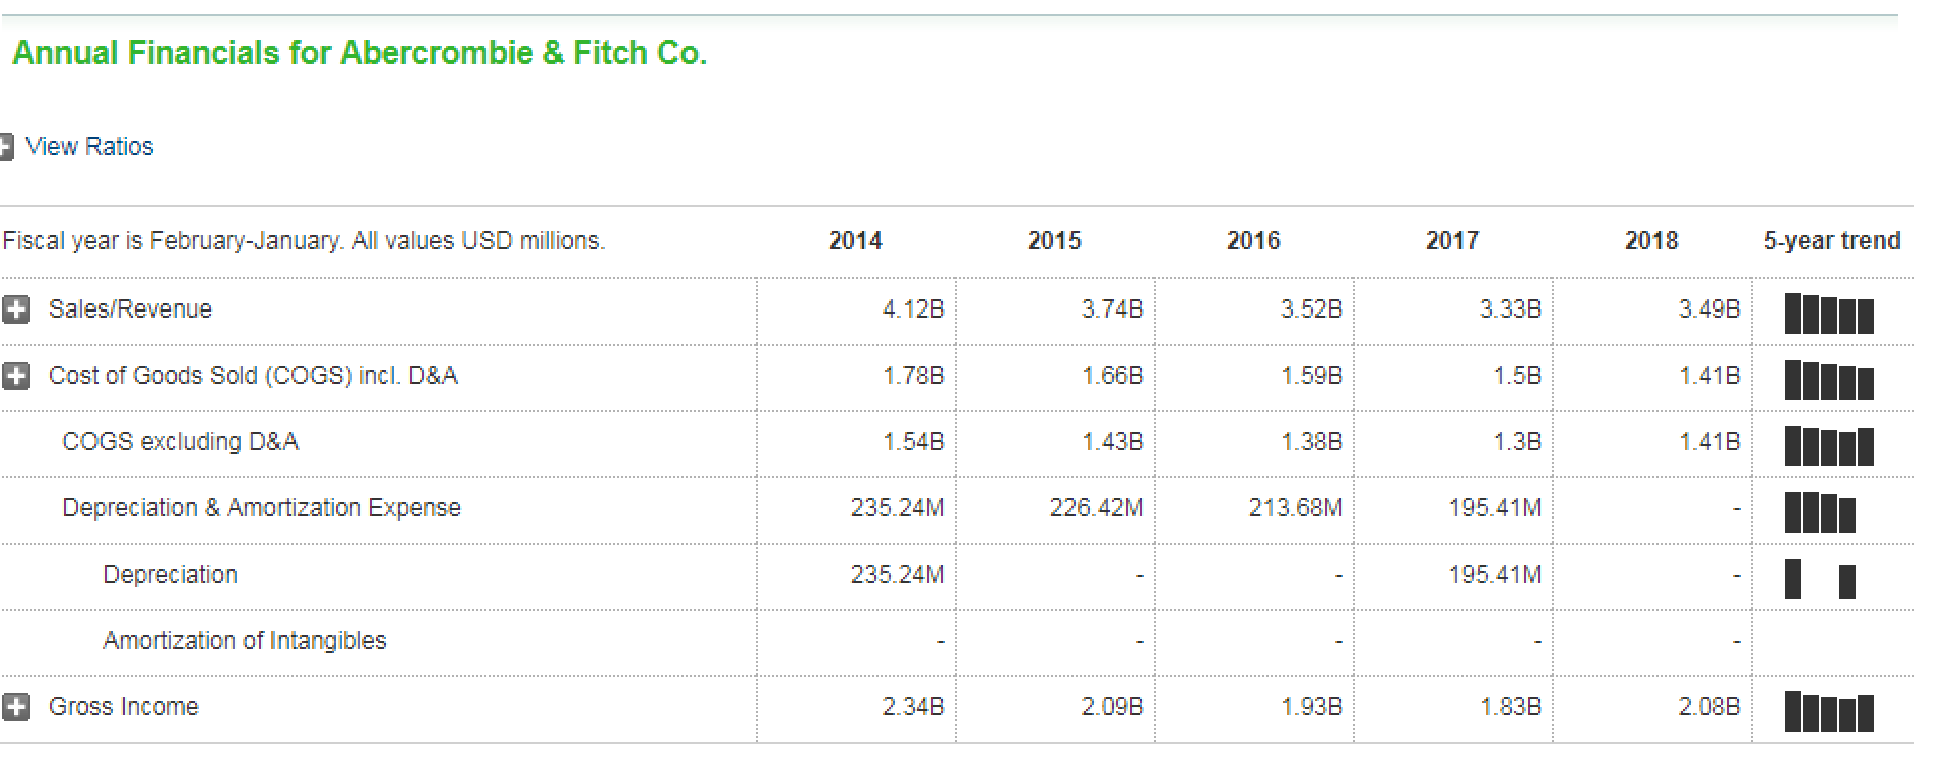
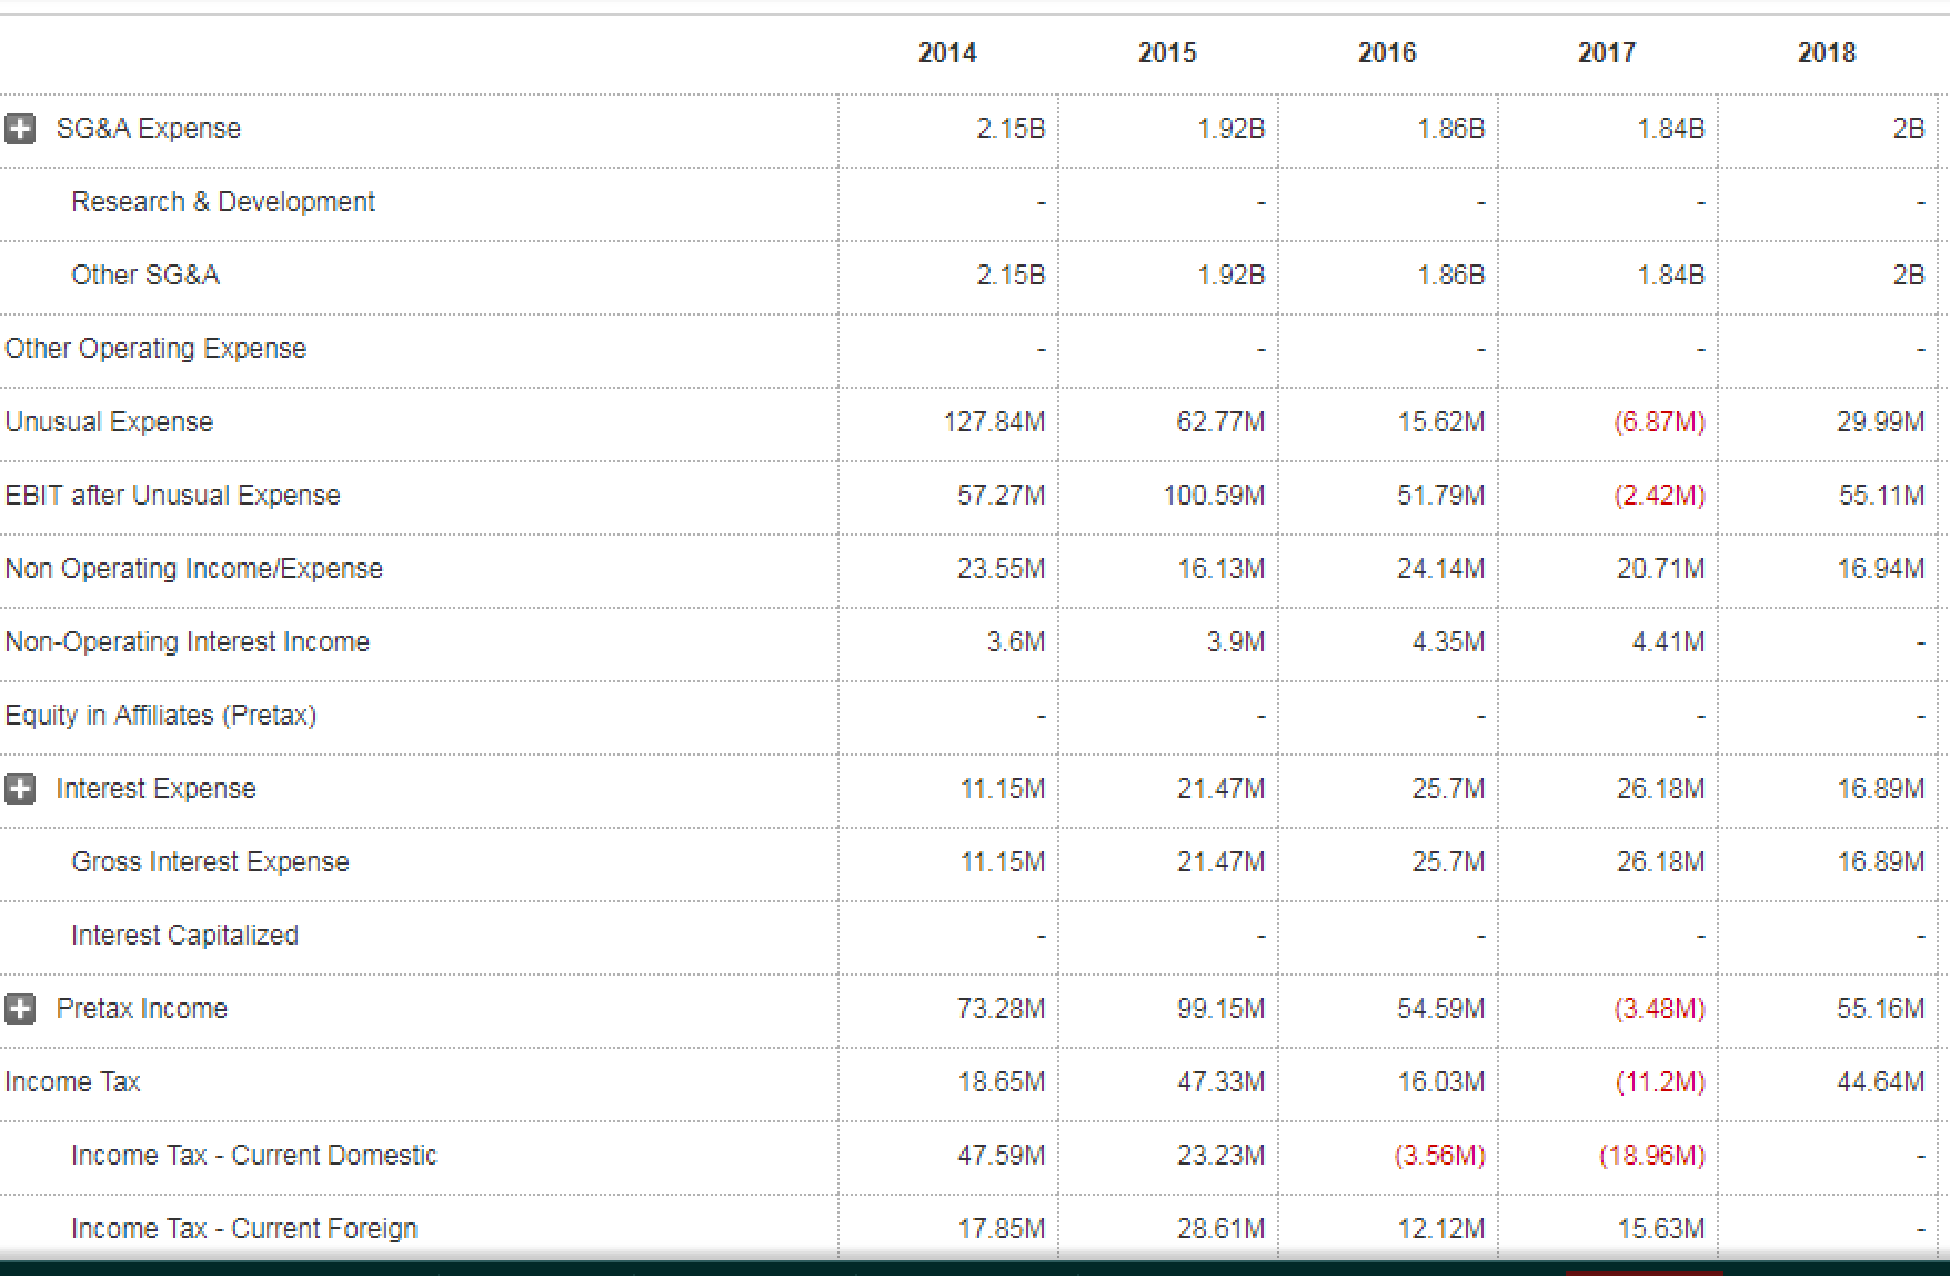
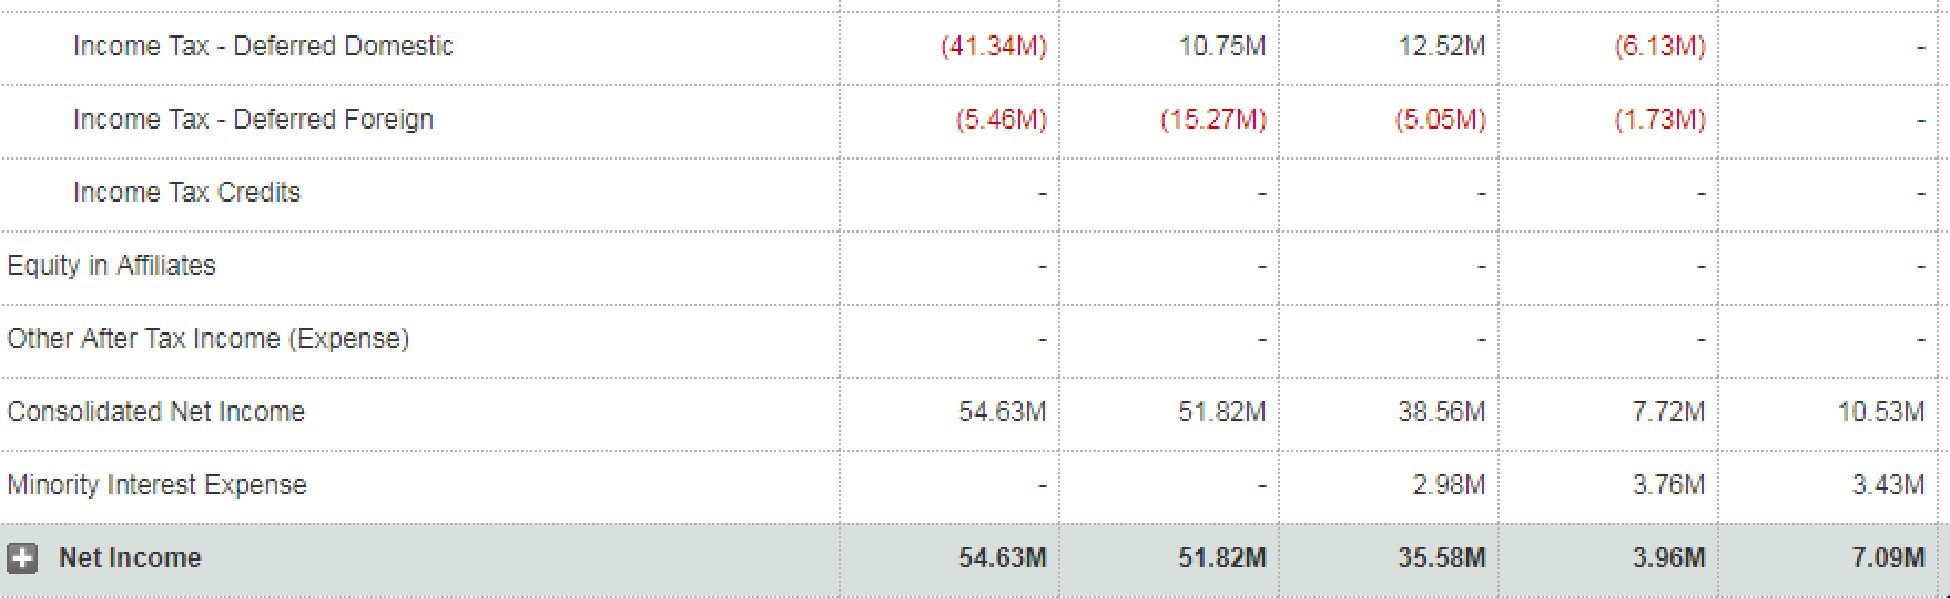
Clothing retailer Abercrombie & Fitch enjoyed phenomenal success in the late 1990s. Between 1996 and 2000, its sales grew almost fourfold—from $335 million to more than $1.2 billion—and its stock price soared by more than 500%. However, in 2002, its growth rate had begun to slow down, and Abercrombie had a hard time meeting its quarterly earnings targets. As a result, the stock price in late 2002 was about half of what it was 3 years earlier. Abercrombie’s struggles resulted from increased competition, a sluggish economy, and the challenges of staying ahead of the fashion curve. From late 2002 until November 2007, the company’s stock rebounded strongly; however, its stock price declined during the 2008 economic downturn. Its stock price rebounded until late October 2011, when it began a downward trend again. Questions remain about the firm’s long-term growth prospects. However the company has been cutting costs and trying to improve productivity with its focus on the supply chain. In addition, it has been actively repurchasing shares, indicating that management believes its shares are undervalued. The company continues to steadily expand stores abroad while closing under-performing domestic stores.
Given the questions about Abercrombie’s future growth rate, analysts have focused on the company’s earnings reports. Financial websites such as Yahoo! Finance, Morningstar, and MSN Money (www.msn.com/en-us/
DISCUSSION QUESTIONS
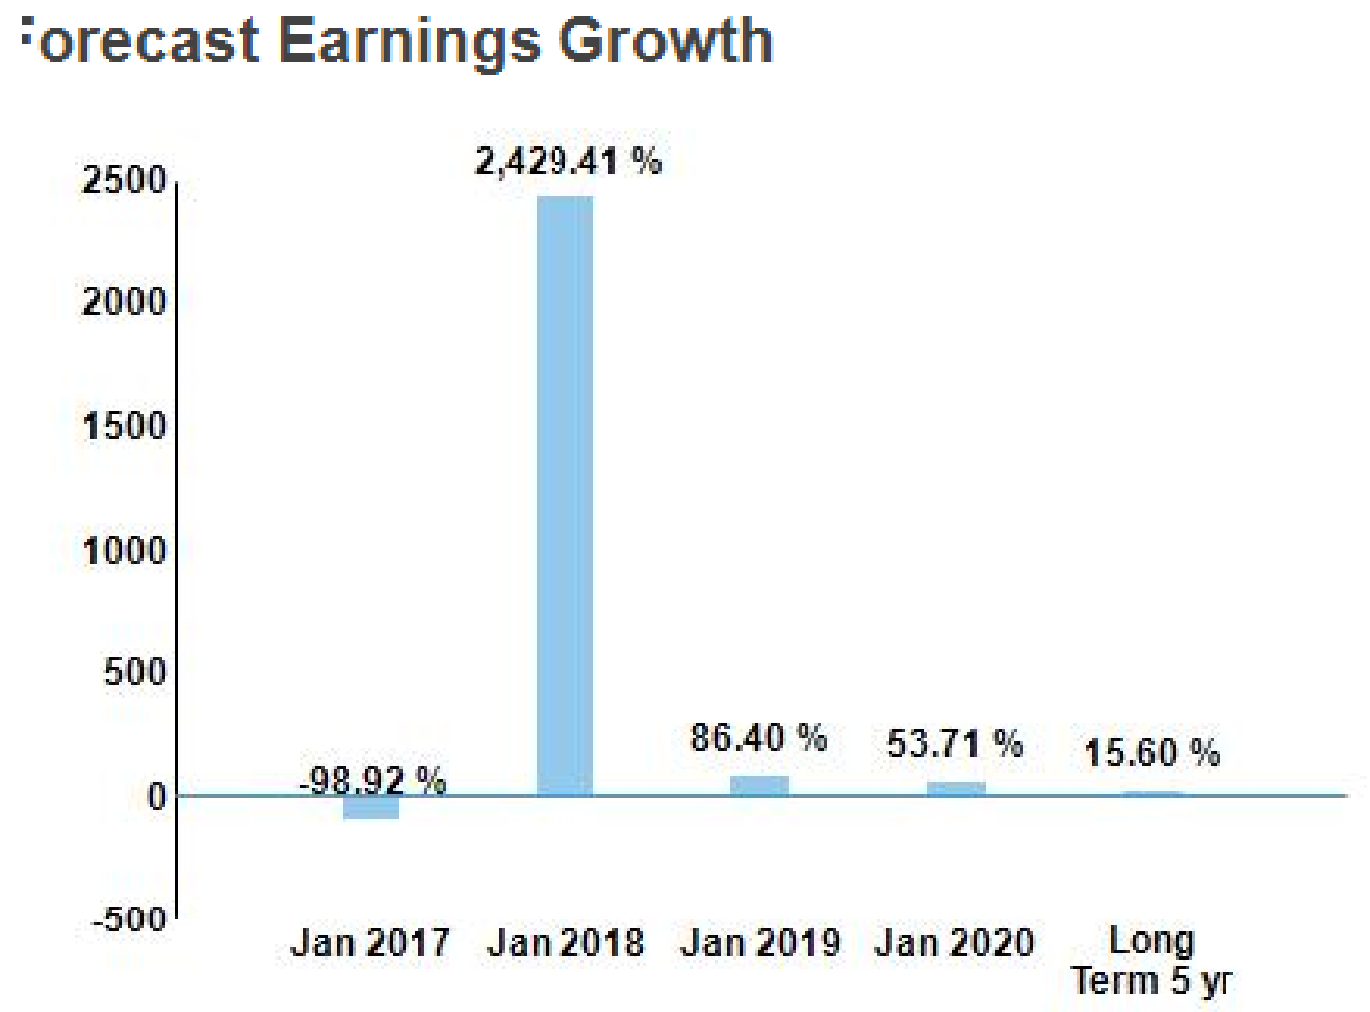
Based on analysts’ forecasts, what is the expected long-term (5-year) growth rate in earnings?
Want to see the full answer?
Check out a sample textbook solution
Chapter 16 Solutions
Fundamentals Of Financial Management, Concise Edition (mindtap Course List)


- Problem Three (15 marks) You are an analyst in charge of valuing common stocks. You have been asked to value two stocks. The first stock NEWER Inc. just paid a dividend of $6.00. The dividend is expected to increase by 60%, 45%, 30% and 15% per year, respectively, in the next four years. Thereafter, the dividend will increase by 4% per year in perpetuity. Calculate NEWER’s expected dividend for t = 1, 2, 3, 4 and 5. The required rate of return for NEWER stock is 14% compounded annually. What is NEWER’s stock price? The second stock is OLDER Inc. OLDER Inc. will pay its first dividend of $10.00 three (3) years from today. The dividend will increase by 30% per year for the following four (4) years after its first dividend payment. Thereafter, the dividend will increase by 3% per year in perpetuity. Calculate OLDER’s expected dividend for t = 1, 2, 3, 4, 5, 6, 7 and 8. The required rate of return for OLDER stock is 16% compounded annually. What is OLDER’s stock price? Now assume that…arrow_forwardProblem Three (15 marks) You are an analyst in charge of valuing common stocks. You have been asked to value two stocks. The first stock NEWER Inc. just paid a dividend of $6.00. The dividend is expected to increase by 60%, 45%, 30% and 15% per year, respectively, in the next four years. Thereafter, the dividend will increase by 4% per year in perpetuity. Calculate NEWER’s expected dividend for t = 1, 2, 3, 4 and 5. The required rate of return for NEWER stock is 14% compounded annually. What is NEWER’s stock price? The second stock is OLDER Inc. OLDER Inc. will pay its first dividend of $10.00 three (3) years from today. The dividend will increase by 30% per year for the following four (4) years after its first dividend payment. Thereafter, the dividend will increase by 3% per year in perpetuity. Calculate OLDER’s expected dividend for t = 1, 2, 3, 4, 5, 6, 7 and 8. The required rate of return for OLDER stock is 16% compounded annually. What is OLDER’s stock price? Now assume that…arrow_forwardProblem Three (15 marks) You are an analyst in charge of valuing common stocks. You have been asked to value two stocks. The first stock NEWER Inc. just paid a dividend of $6.00. The dividend is expected to increase by 60%, 45%, 30% and 15% per year, respectively, in the next four years. Thereafter, the dividend will increase by 4% per year in perpetuity. Calculate NEWER’s expected dividend for t = 1, 2, 3, 4 and 5. The required rate of return for NEWER stock is 14% compounded annually. What is NEWER’s stock price? The second stock is OLDER Inc. OLDER Inc. will pay its first dividend of $10.00 three (3) years from today. The dividend will increase by 30% per year for the following four (4) years after its first dividend payment. Thereafter, the dividend will increase by 3% per year in perpetuity. Calculate OLDER’s expected dividend for t = 1, 2, 3, 4, 5, 6, 7 and 8. The required rate of return for OLDER stock is 16% compounded annually. What is OLDER’s stock price? Now…arrow_forward
- You are considering a 10-year, $1,000 par value bond. Its coupon rate is 11%, and interest is paid semiannually. Bond valuation Years to maturity 10 Par value of bond $1,000.00 Coupon rate 11.00% Frequency interest paid per year 2 Effective annual rate 8.78% Calculation of periodic rate: Formulas Nominal annual rate #N/A Periodic rate #N/A Calculation of bond price: Formulas Number of periods #N/A Interest rate per period 0.00% Coupon payment per period #N/A Par value of bond $1,000.00 Price of bond #N/Aarrow_forwardHow much do investor psychology and market sentiment play into stock price movements? Do these emotional reactions having a bigger impact on short-term swings, or do they also shape long-term trends in a meaningful way?arrow_forwardExplain The business of predatory tax return preparation, including: How they deceive the working poor,The marketing tactics the preparers use, and Other than paying high fees, what negative impact can the use of these unqualified and unregulated preparers have on the taxpayer?arrow_forward
- Explain the changes in tax return preparation you would like to see in Alabama, based on what has been successful in other states.arrow_forwardExplain the understanding (or misunderstanding) of the working poor with tax return preparation within one page report.arrow_forwardExplain the regulations or requirements for tax return preparers in Alabama.arrow_forward
- question 1. Toodles Inc. had sales of $1,840,000. Cost of goods sold, administrative and selling expenses, and depreciation expenses were $1,180,000, $185,000 and $365,000 respectively. In addition, the company had an interest expense of $280,000 and a tax rate of 35 percent. (Ignore any tax loss carry-back or carry-forward provisions.)Arrange the financial information for Toodles Inc. in an income statement and compute its OCF?Question 2 Anti-Pandemic Pharma Co. Ltd. reports the following information in its income statement: Sales = $5,250,000;Costs = $2, 173,000;Other expenses = $187,400; Depreciation expense = $79,000; Interest expense= $53,555; Taxes = $76,000; Dividends = $69,000. $136,700 worth of new shares were also issued during the year and long-term debt worth $65,300 was redeemed.a) Compute the cash flow from assetsb) Compute the net change in working capitalQuestion 3Footfall Manufacturing Ltd. reports the following financial information at the end of the current year:…arrow_forwardAccrued Interest PayableCompute the interest for December accrued on each of the following notes payable owed by Riff-Raff'n Yell Inc., on December 31: Day of Calendar: 1 Lender: New Age Principal: $10,000 Interest Rate: 5% Term (Days) 120 Day of Calendar: 8 Lender: Wyvern Tavern Principal: $8,000 Interest Rate: 6% Term (Days) 90 Day of Calendar: 17 Lender: Cedar Tree Principal: $15,000 Interest Rate: 4% Term (Days) 90 Note: Use 360 days for calculations and round to the nearest dollar. Riff-Raff'n Yell, Inc. Lender (in alphabetical order) Accrued Interest Cedar Tree Answer 1 New Age Answer 2 Wyvern Tavern Answer 3arrow_forwardQuestion Footfall afacturing pers The following fancial information at the end of the current years Inventory turnover ratio Fixed accetturnover ratio bot to assets ratia set profit ang ross profit margin the given information to fill at the templates for income statement and balance sheet geb In Statement of Footfall Manufacturing Ltd. for the year ending RELEASED BY THE CL MOME2003, FEBRUARY 9, 3005 Sales December 31, 20 Cast of other expec Earnings befo Camings afterarrow_forward
 Fundamentals of Financial Management, Concise Edi...FinanceISBN:9781305635937Author:Eugene F. Brigham, Joel F. HoustonPublisher:Cengage Learning
 Fundamentals Of Financial Management, Concise Edi...FinanceISBN:9781337902571Author:Eugene F. Brigham, Joel F. HoustonPublisher:Cengage Learning
 Excel Applications for Accounting PrinciplesAccountingISBN:9781111581565Author:Gaylord N. SmithPublisher:Cengage Learning
 Fundamentals of Financial Management (MindTap Cou...FinanceISBN:9781285867977Author:Eugene F. Brigham, Joel F. HoustonPublisher:Cengage Learning
 Fundamentals of Financial Management (MindTap Cou...FinanceISBN:9781337395250Author:Eugene F. Brigham, Joel F. HoustonPublisher:Cengage Learning
 Financial Reporting, Financial Statement Analysis...FinanceISBN:9781285190907Author:James M. Wahlen, Stephen P. Baginski, Mark BradshawPublisher:Cengage Learning