
Concept explainers
Videos
In an FCC structure, the atoms are found on the corners of the cubic unit cell and at the center of each face. The unit cell has an edge whose length is the distance from the center of one corner atom to the center of another corner atom on the same edge. The atoms on the diagonal of any face are touching. One of the faces of the unit cell is shown below in the following:
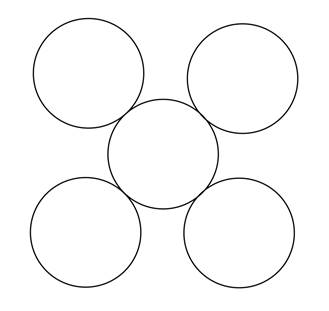
a. Show the distance
b. What is the relationship between the length of the face diagonal and the radius of the atoms in the cell?
Face diagonal
c. How is the radius of the atoms related to
d. Silver metal crystals have an FCC structure. The unit cell edge in silver is
______________

Trending nowThis is a popular solution!

Chapter 16 Solutions
CHM 111/112 LAB MANUAL >C<


- Curved arrows are used to illustrate the flow of electrons. Using the provided starting and product structures, draw the curved electrons-pushing arrows for the following reaction or mechanistic step(s).arrow_forwardCurved arrows are used to illustrate the flow of electrons. Using the provided starting and product structures, draw the curved electron-pushing arrows for the following reaction or mechanistic step(s). Be sure to account for all bond-breaking and bond-making steps. I I I H Select to Add Arrows HCI, CH3CH2OHarrow_forwardCurved arrows are used to illustrate the flow of electrons. Use the reaction conditions provided and the follow the arrows to draw the intermediate and product in this reaction or mechanistic step(s).arrow_forward
- Curved arrows are used to illustrate the flow of electrons. Use the reaction conditions provided and follow the curved arrows to draw the intermediates and product of the following reaction or mechanistic step(s).arrow_forwardCurved arrows are used to illustrate the flow of electrons. Use the reaction conditions provided and follow the arrows to draw the intermediate and the product in this reaction or mechanistic step(s).arrow_forwardLook at the following pairs of structures carefully to identify them as representing a) completely different compounds, b) compounds that are structural isomers of each other, c) compounds that are geometric isomers of each other, d) conformers of the same compound (part of structure rotated around a single bond) or e) the same structure.arrow_forward
- Given 10.0 g of NaOH, what volume of a 0.100 M solution of H2SO4 would be required to exactly react all the NaOH?arrow_forward3.50 g of Li are combined with 3.50 g of N2. What is the maximum mass of Li3N that can be produced? 6 Li + N2 ---> 2 Li3Narrow_forward3.50 g of Li are combined with 3.50 g of N2. What is the maximum mass of Li3N that can be produced? 6 Li + N2 ---> 2 Li3Narrow_forward
- Concentration Trial1 Concentration of iodide solution (mA) 255.8 Concentration of thiosulfate solution (mM) 47.0 Concentration of hydrogen peroxide solution (mM) 110.1 Temperature of iodide solution ('C) 25.0 Volume of iodide solution (1) used (mL) 10.0 Volume of thiosulfate solution (5:03) used (mL) Volume of DI water used (mL) Volume of hydrogen peroxide solution (H₂O₂) used (mL) 1.0 2.5 7.5 Time (s) 16.9 Dark blue Observations Initial concentration of iodide in reaction (mA) Initial concentration of thiosulfate in reaction (mA) Initial concentration of hydrogen peroxide in reaction (mA) Initial Rate (mA's)arrow_forwardDraw the condensed or line-angle structure for an alkene with the formula C5H10. Note: Avoid selecting cis-/trans- isomers in this exercise. Draw two additional condensed or line-angle structures for alkenes with the formula C5H10. Record the name of the isomers in Data Table 1. Repeat steps for 2 cyclic isomers of C5H10arrow_forwardExplain why the following names of the structures are incorrect. CH2CH3 CH3-C=CH-CH2-CH3 a. 2-ethyl-2-pentene CH3 | CH3-CH-CH2-CH=CH2 b. 2-methyl-4-pentenearrow_forward
 Chemical Principles in the LaboratoryChemistryISBN:9781305264434Author:Emil Slowinski, Wayne C. Wolsey, Robert RossiPublisher:Brooks Cole
 Chemistry: Principles and PracticeChemistryISBN:9780534420123Author:Daniel L. Reger, Scott R. Goode, David W. Ball, Edward MercerPublisher:Cengage Learning
 Chemistry & Chemical ReactivityChemistryISBN:9781337399074Author:John C. Kotz, Paul M. Treichel, John Townsend, David TreichelPublisher:Cengage Learning
 Chemistry & Chemical ReactivityChemistryISBN:9781133949640Author:John C. Kotz, Paul M. Treichel, John Townsend, David TreichelPublisher:Cengage Learning
 Chemistry: The Molecular ScienceChemistryISBN:9781285199047Author:John W. Moore, Conrad L. StanitskiPublisher:Cengage Learning
 General Chemistry - Standalone book (MindTap Cour...ChemistryISBN:9781305580343Author:Steven D. Gammon, Ebbing, Darrell Ebbing, Steven D., Darrell; Gammon, Darrell Ebbing; Steven D. Gammon, Darrell D.; Gammon, Ebbing; Steven D. Gammon; DarrellPublisher:Cengage Learning